October 15, 2019
Giving stakeholders the opportunity to visualize transportation solutions before they become reality can confirm a project’s course, or change it for the better.
Visualization is the process of digitally bringing data and planning concepts to life, and it is a powerful tool in the transportation planning and engineering world. Through visualization, we can help stakeholders visually experience key components of proposed or planned projects. We can give decision makers the information they need by modeling the impacts of alternatives. We can become aware of, and deal with, highly specific and context-dependent design challenges. Once decisions are made, we can help communities adapt and prepare for improvements that will ultimately make their roads safer and commutes easier.
Visualization techniques are vast and varied. Examples include:
- 3D modeling that maps out a road design or intersection functionality
- Static images demonstrating the difference between current and alternative scenarios
- Animations and motion graphics that tell a complex story quickly from multiple perspectives
- Augmented reality that brings a scenario to life through a first-person perspective
Effective visualization can equip decision makers, involve community members, and inform planners and designers. In addition, showing people a compelling picture of the future can generate support and enthusiasm for your project.
Visualizing a Safer Future in Boise
The power of technology is such that we can help residents acclimate to the design of a new and innovative intersection design before it’s even built.
South of Boise, Idaho, the Ada County Highway District (ACHD) is modifying an intersection that’s currently experiencing high congestion during peak commuter times. They’re adding more thru lanes, and giving drivers a different way to make left turns: a ThrU-Turn lane that require drivers to go through the intersection before making a U-turn at a designated signal down the road.
With the switch to ThrU-Turn lanes, the community should expect a 50% reduction in travel time, as well as increased safety for all travel modes. The new intersection design will be an adjustment, however.
In order to prepare the community for the change and help them smoothly navigate the new ThrU-Turn design, Kittelson supported ACHD by creating a public information video that explains the new functionality and its purposes.
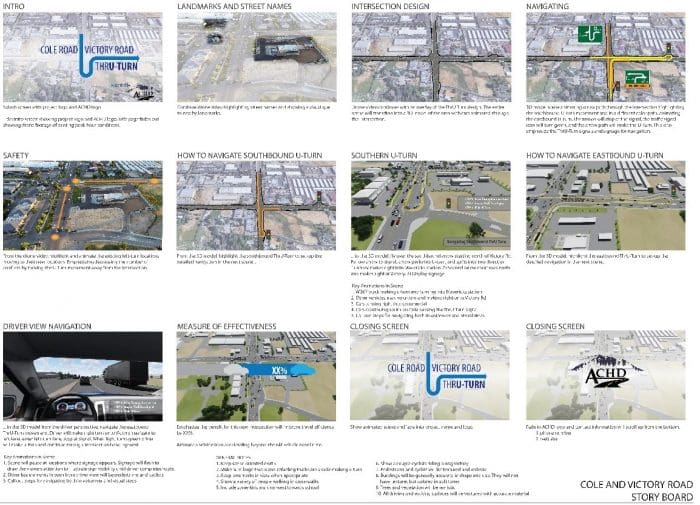
The storyboard that guided video production, built through collaboration with ACHD.
After solidifying the video’s structure and key elements through a storyboard, we employed these techniques to produce the video:
- Aerial Footage: Gathered drone footage of the current intersection.
- 3D Modeling: Used CAD files and modeling software to transform the aerial footage into a model of what the intersection will look like after the intersection is redesigned.
- Motion Graphics: Designed on-screen animations to draw attention to key elements in the video and help the viewer follow along.
- Voiceover/Closed Captioning: Recorded voiceover to guide the viewer though the process, and supplemented it with on-screen text for ease of processing the directions.
The final video is helping residents of Ada County feel comfortable with changes coming to the Cole/Victory intersection. This is just one example of the wealth of possibility embedded in visualization capabilities for projects.
Selecting and Executing Visualization Methods
While every visualization project is different, there are a few core considerations you should keep in mind as you think about ways to digitally bring your concepts to life.
- Who is my audience? There are many highly effective visualization techniques, but don’t get distracted by “shiny objects” that won’t resonate with your particular audience. Start with an understanding of their needs and the way they take in information, and match your visualization method accordingly.
- What is my “call to action”? In the case of the Ada County intersection, we simply wanted residents to feel comfortable, and to direct them to ACHD’s website in case of any questions. You may have a more specific next step in mind, though, like providing comments or taking a survey. Consider how the visualization piece can inspire your audience to action.
- What challenges does this visualization piece need to solve? Be sure your piece has a clear message and answers the right questions.
- How will it be distributed? Keeping the communication vehicle in mind will help you structure format, length, and file sizes accordingly for a product you can use.
Effective visualization has the power to change a project’s narrative, or confirm planning decisions that are right for a community’s efficiency and safety. If your agency is dealing with challenging project decisions, hard-to-understand treatments, or the need to communicate innovative design solutions, I encourage you to learn more about visualization techniques available to you. Feel free to reach out to me with any questions – I’d be glad to help you explore how to visually tell your project’s story.