May 18, 2022
What Is NCHRP Research Report 992?
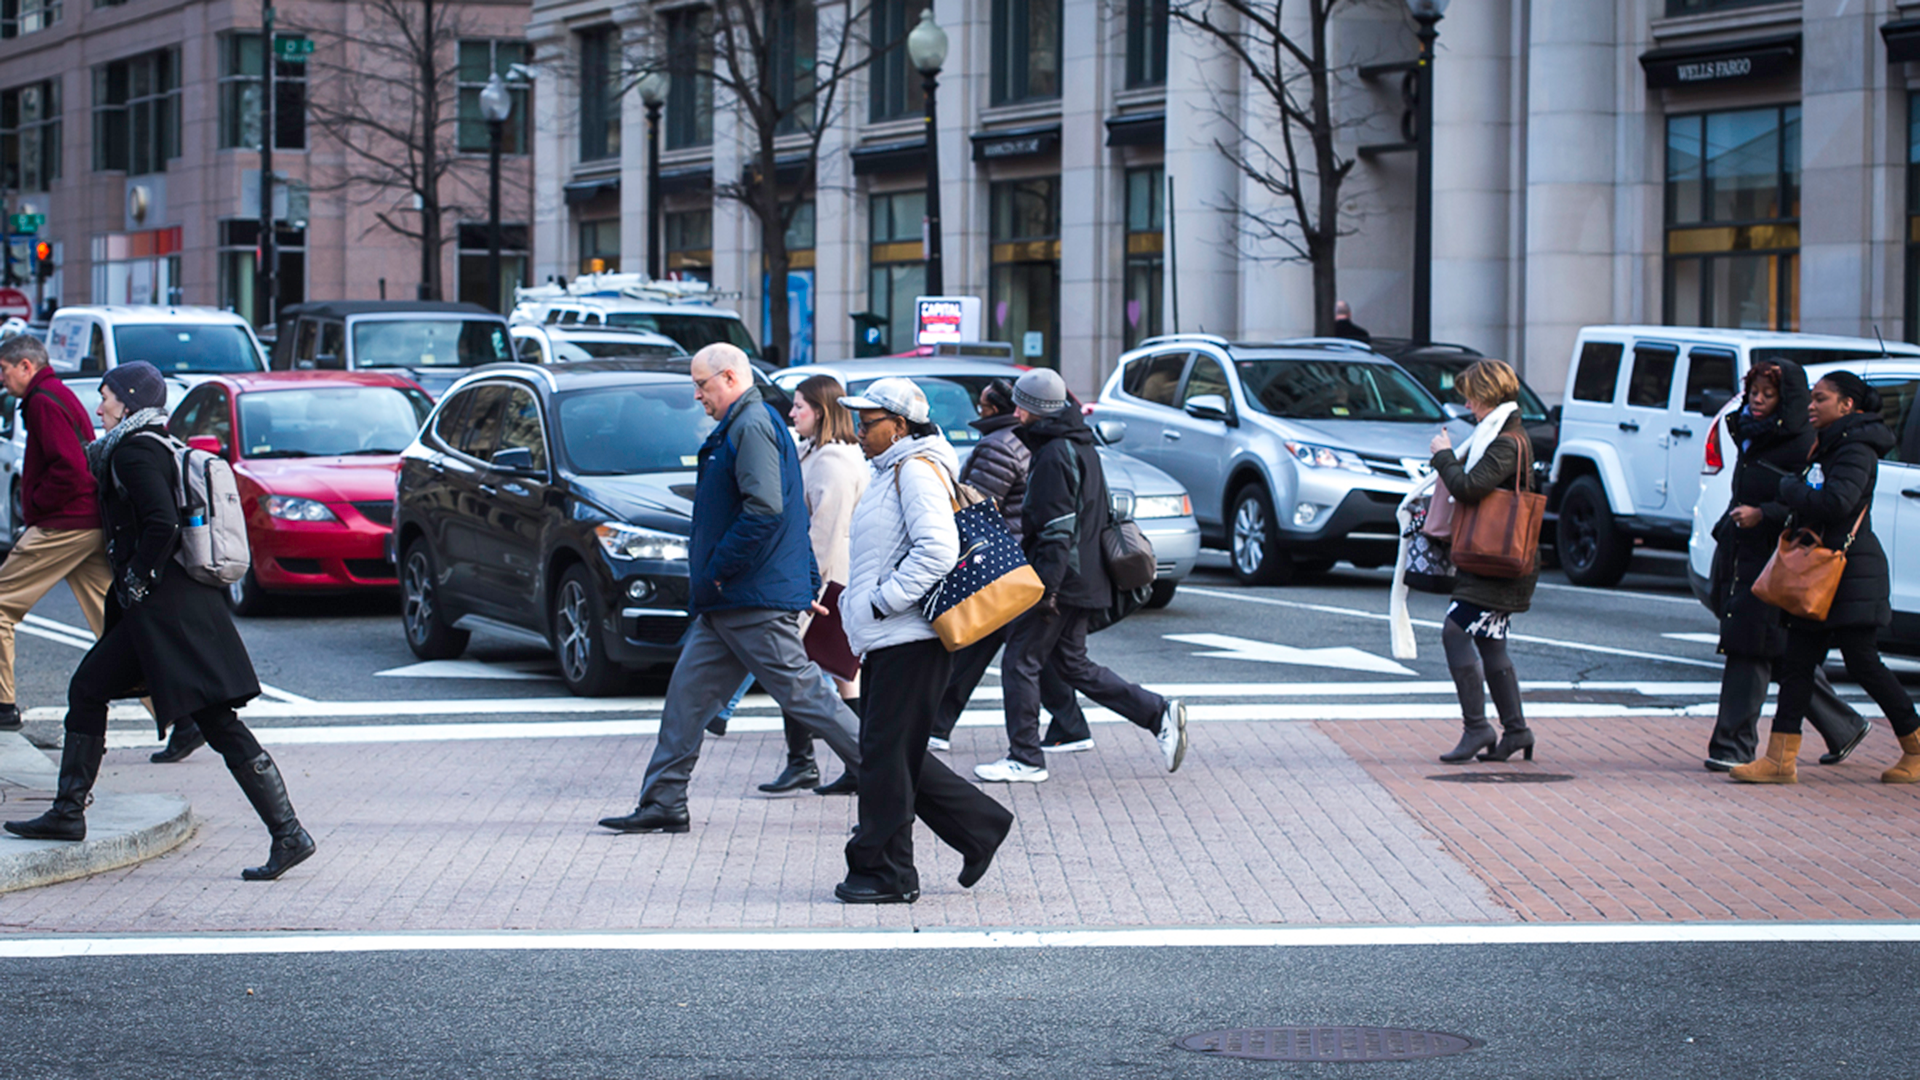
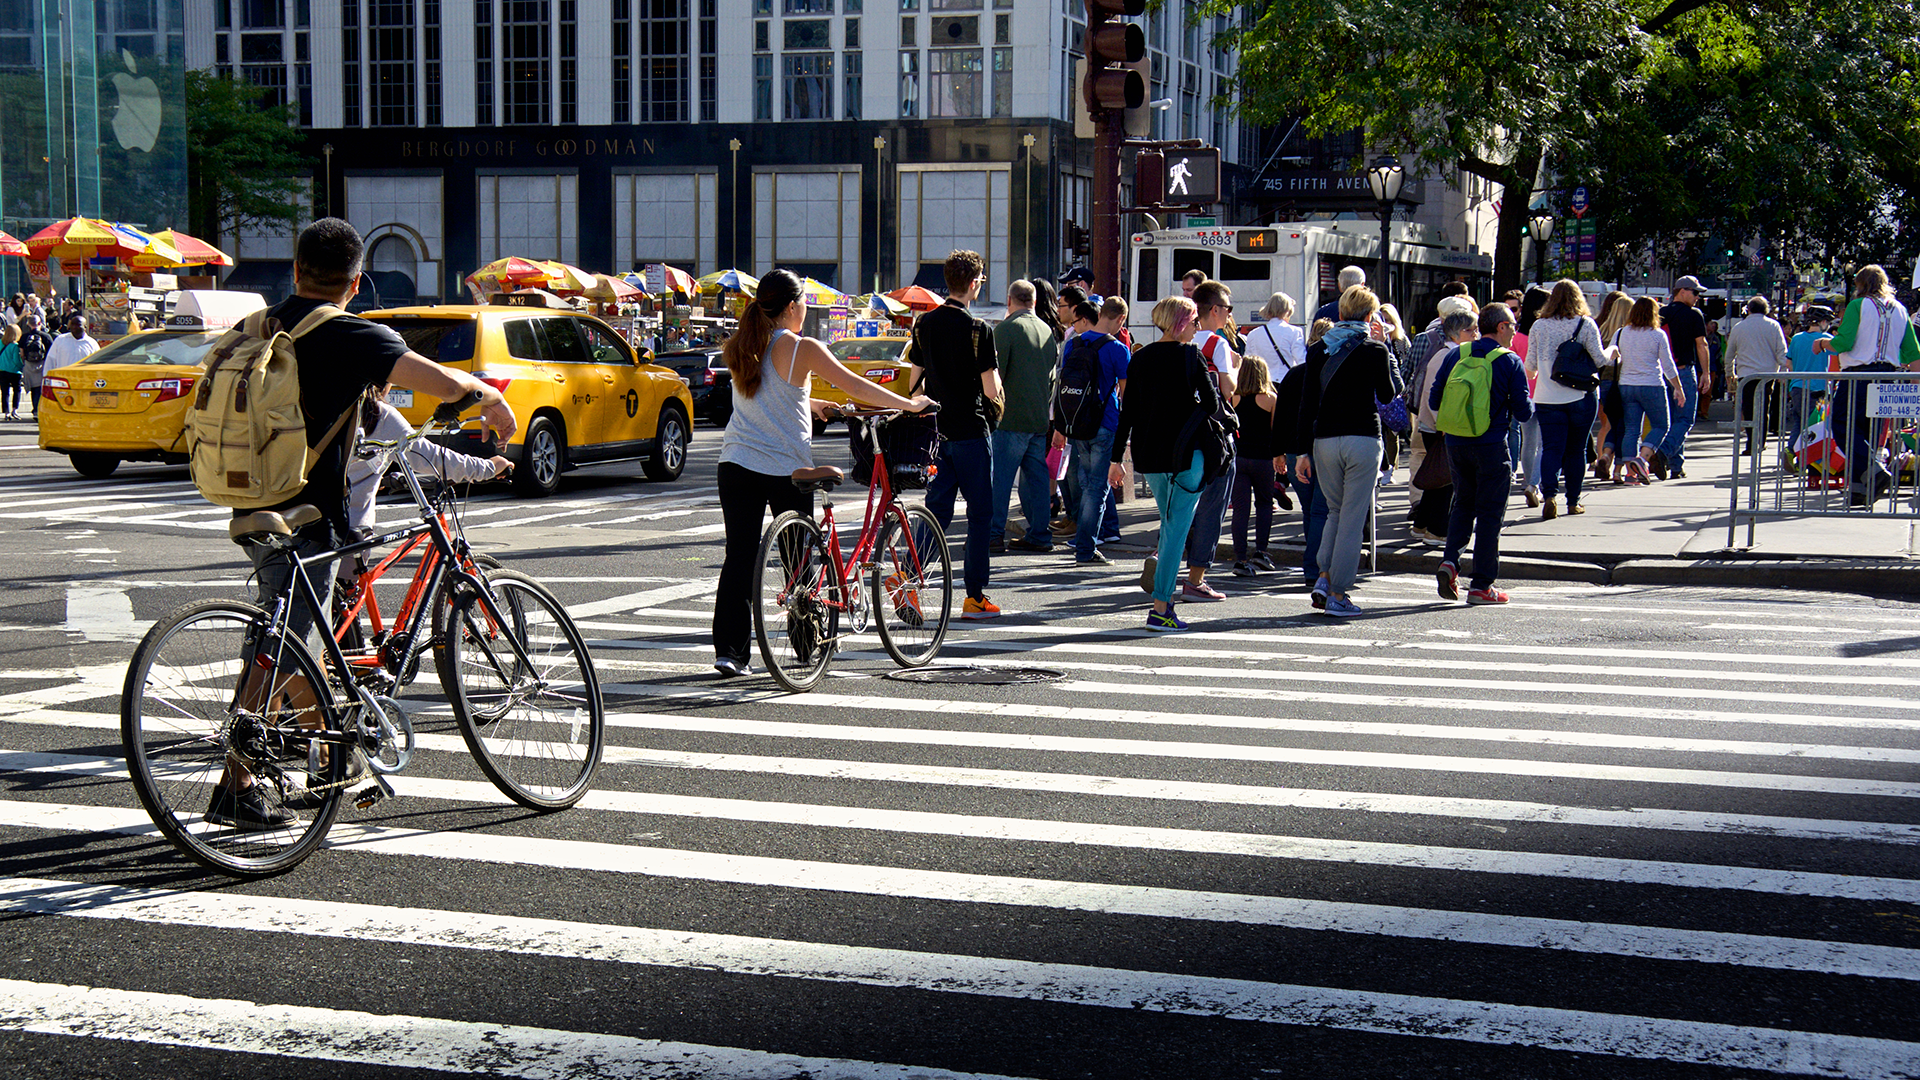
Walking is the second-most-common means of getting around, with trips made primarily by walking accounting for more than 10% of all trips. In addition, most trips made by public transit or private vehicles involve walking at some point, such as walking to and from transit stops or parking spaces.
Despite walking’s importance, it has lagged behind the motor vehicle and transit modes in terms of guidance and methods for developing safe, functional, and attractive facilities for people who walk. Earlier this year, to address this oversight, the Transportation Research Board’s National Cooperative Highway Research Program released Research Report 992: Guide to Pedestrian Analysis.
A Kittelson team co-authored NCHRP Research Report 992 along with researchers from Portland State University and the University of North Carolina Highway Safety Research Center, and the guide describes current practice for counting pedestrians and performing pedestrian safety, operations, and quality-of-service analyses. Read on to learn the guide’s major findings and observations and, most importantly, how we think it can serve as a useful resource for those who wish to better understand how pedestrians use roads.

Walking is the second-most-common means of getting around, with trips made primarily by walking accounting for more than 10% of all trips.
How Does the Guide Work?
The guide is divided into five chapters and two appendices. The first chapter provides a roadmap for using the guide. The guide’s remaining four chapters each focus on a distinct area of pedestrian analysis. These four areas are:
- pedestrian volume counting;
- pedestrian safety analysis;
- pedestrian operations analysis; and
- pedestrian quality-of-service analysis.
The guide isn’t designed as a cover-to-cover read; instead, its neat divisions make it a useful reference for planners and engineers who want to quickly access information on one of these four topics. Similarly, the report’s design isn’t to overload readers with information on any one topic, but rather to raise awareness of useful applications for different kinds of pedestrian analysis, describe current practice for each topic, and connect readers to other, more comprehensive sources of information.
A starting point for any pedestrian analysis is understanding how many pedestrians use-or would like to use-a facility. While departments of transportation have long-established programs for counting vehicles on roadways, acquiring pedestrian counts has always been a taller order. Simple issues of visibility make it far more difficult to accurately count people who walk or cycle than people who drive. People who drive are also more predictable in their transportation routines than people who walk or cycle, as factors like weather produce wide variation in pedestrian volume patterns, increasing the difficulty of attaining even an estimate pedestrian count. The guide describes current pedestrian counting and volume estimation practice, including where, when, and how to count pedestrians; how to ensure data quality; and how to use a variety of sampling methods to supplement 100% count data. Readers are then guided to other FHWA and NCHRP guides for details about establishing pedestrian count programs.
 Over 6,500 pedestrians were killed in collisions with motor vehicles in 2020, a 51% increase over the number of fatalities in 2010. To help agencies prioritize locations for installing pedestrian safety countermeasures, the guide’s second chapter, on safety analysis, starts by describing methods for evaluating the potential for a crash to occur. Next, the guide describes approaches for identifying locations to treat, along with each approach’s strengths and weaknesses. Finally, the chapter provides estimates of the effect of a variety of safety countermeasures on crashes. This latter area is the subject of ongoing research, and the chapter points readers to sources to monitor for the latest research results.
Pedestrian operations analysis, the subject of the guide’s third chapter, is used in designing and managing pedestrian facilities to ensure that sufficient space is provided to accommodate pedestrian movement along with other desired uses in the sidewalk area, such as landscaping, shop displays, or restaurant seating. Operations analysis also contributes to safety analysis, as sidewalks that are too crowded can encourage people to walk in the street, and delays waiting to cross a street can cause some pedestrians to try to cross at inappropriate times. The guide provides information on applications for operations analysis and ways to measure pedestrian operations.
The guide’s final chapter describes methods for evaluating how well pedestrian facilities operate from a pedestrian’s perspective, a concept known as quality of service. These measures can be used in conjunction with safety analyses to provide additional support for installing safety treatments at locations. They can also be used by themselves to plan improvements to pedestrian networks that improve connectivity, perceived safety and security, comfort, and general pedestrian satisfaction. The research behind NCHRP Research Report 992 developed new methods for evaluating the effects of pedestrian safety countermeasures at crossing locations on pedestrian satisfaction. These methods have been incorporated into the new Highway Capacity Manual (HCM) 7th edition. They are also described in the guide’s appendices, including instructions for a spreadsheet-based tool that applies the new methods.

Operations analysis also contributes to safety analysis, as sidewalks that are too crowded can encourage people to walk in the street, and delays waiting to cross a street can cause some pedestrians to try to cross at inappropriate times.
What Does the Research Reveal?
To develop the new methods to estimate pedestrian delay and satisfaction while crossing the street, the research team surveyed pedestrians immediately after they had crossed the street. The team also made video recordings of these crossings, to better understand each surveyed pedestrian’s crossing experience: did they have to wait to cross the street, and if they did wait, did motorists yield to them or otherwise interact with them?
At uncontrolled crossings, we studied three types of safety countermeasures and compared them to unmarked crossings. The three countermeasures were:
- marking a crosswalk;
- putting in medians to allow pedestrians to cross one direction of traffic at a time; and
- using rectangular rapid flashing beacons.
The study found that all three countermeasure treatments resulted in increased pedestrian satisfaction beyond each treatment’s effects on improving motorist yielding and/or reducing crossing distance. Although the research was not able to study the full range of available countermeasures, the evaluation method developed by the research can nevertheless estimate any countermeasure’s effect on pedestrian satisfaction and delay resulting from improved motorist yielding or reduced crossing distances.
Continue the Conversation
We at Kittelson want to stay current on industry best practices, and to share our work developing cutting-edge methodologies with cities across the country. Feel free to reach out to either of us to discuss any of these ideas further. For more information on NCHRP, visit the TRB website, or watch a short video on Research Report 992 here.
