July 21, 2021

Lara Bouck | MetroPlan Orlando
MetroPlan Orlando-the metropolitan transportation organization for Central Florida-is best known as the forum for long-range planning and transportation discussions in the region. But Lara Bouck, a project manager with MetroPlan Orlando, also likes to do work that benefits people in the short term.
One of Lara’s roles as manager of the Signal Retiming Program is to work closely with municipalities, the Florida Department of Transportation (FDOT), and other partners to reduce delays at traffic signals and make travel in Central Florida more reliable. Each year, MetroPlan Orlando engages a small number of signal retiming engineers to develop and implement new timings for signals throughout the region. It then retains Kittelson to perform before/after analyses that quantify the reductions in travel time resulting from the retimings. In addition to reducing vehicular delay and making travel times more predictable, Lara envisions using the retiming of traffic signals as a way to advance the MetroPlan Orlando board’s priorities, starting with safety for all road users.
A New Method of Data Collection for Before/After Analyses
When the COVID-19 pandemic disrupted Bluetooth data collection for the before/after analyses, we approached Lara with an idea: instead of using Bluetooth readers that pick up cars as they go by, why don’t we go straight to the source and get data from connected vehicles themselves?
Lara and MetroPlan Orlando staff were intrigued by the potential to support safety applications, an added benefit over the Bluetooth readers that Kittelson had historically used for the before/after analyses. (Bluetooth readers are limited to reporting travel times from one end of the corridor to the other.)
The connected vehicle dataset we proposed comes from tens of thousands of newer vehicles in the MetroPlan Orlando region. This data is comparable in resolution and precision to another transportation data mainstay: GPS-assisted floating cars. However, a key difference is that connected vehicle data is passively collected from tens of thousands of vehicles in an anonymized manner, instead of from a handful of (paid) floating car drivers. As a result, connected vehicle data can be obtained for months at a time covering the entire region, versus a few hours on one or two corridors with floating car runs.
The biggest risk with this method was that we could not point Lara to examples of other planning agencies using this type of data. Undeterred, Lara made the call to give it a try and have Kittelson conduct exploratory analyses to better understand the data and its potential.
What We Learned About Connected Vehicle Data
In collaboration with Lara and staff at MetroPlan Orlando, Kittelson selected three focus areas for applying connected vehicle data from Wejo. Here’s what we found:
- Signal retiming before/after analyses: As the catalyst for evaluating this data, we began with questions related to the impact on signal retiming. In addition to being able to obtain travel times comparable with other field-collected data sources, Kittelson computed a variety of performance measures that can aid not only in understanding the impact of signal retiming, but also to inform which corridors should be retimed and the needs of people using them.
Kittelson estimated the average delay at traffic signals by comparing motorists' travel times through a signal versus the travel time of motorists that did not stop.
Animating the connected vehicle data shows how queues form and dissipate at traffic signals.
- Speeding: Drivers going faster than the speed limit reduce safety for other road users. However, obtaining data on how fast people are driving usually requires field data collection, which is not feasible for a region as large as MetroPlan Orlando’s. With connected vehicle data, we can isolate midblock segments across a neighborhood or a city and pinpoint the roads where speeding is taking place.
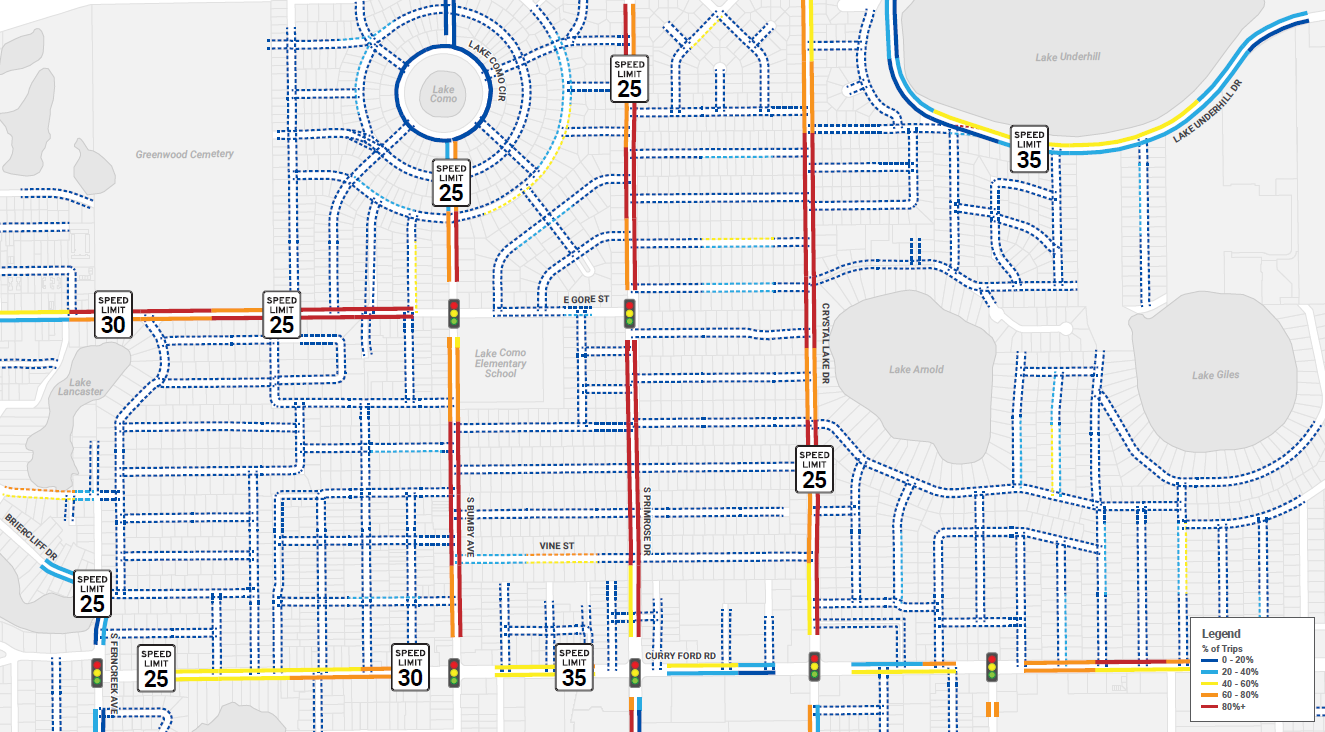
This map of Orlando's Lake Como neighborhood shows that a large percentage of motorists on north-south roads travel faster than the speed limit.
- Conflict points: The granular detail of connected vehicle data enabled us to locate areas along a road where pedestrians and bicyclists conflict with a large number of motorists. While an aerial or field review can identify driveway locations, connected vehicle data can be used to reveal how people use the driveways. For example, the number and speed of vehicles turning into a driveway can be estimated. Furthermore, instances of hard braking-perhaps due to unexpected people or objects in front of drivers-can be tied to these conflict points.
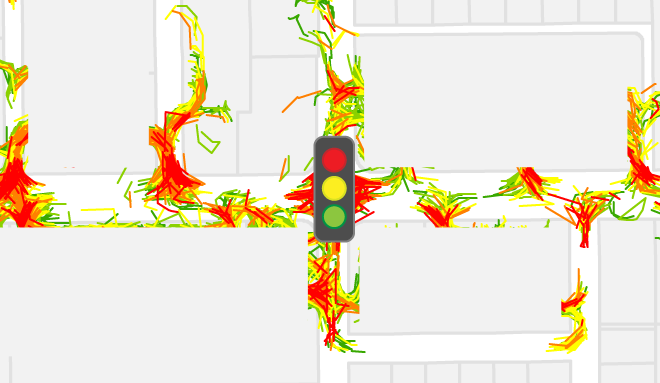
Connected vehicle data along Curry Ford Road shows how some driveways have more turning activity than cross streets.
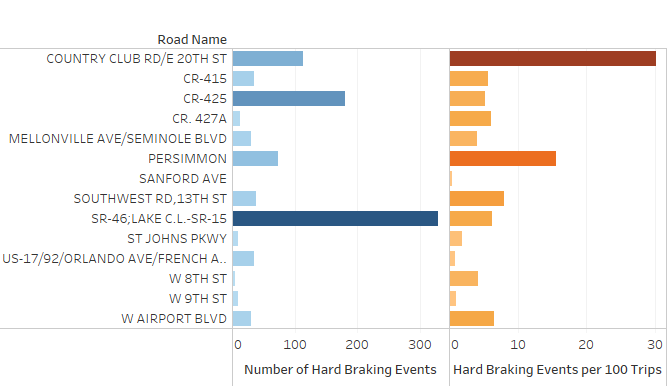
Kittelson's analysis of the incidence and rate of hard braking events in Sanford highlighted locations where near-miss crashes may be happening.
With a better understanding of connected vehicle data, Lara and Kittelson are working to raise awareness of this resource to their local partners and to use it for a wide variety of projects over the next year. To talk further about our methodology, findings, or anything else related to connected vehicle data, feel free to reach out to any one of us!
- Jorge Barrios, Associate Engineer
- Christopher Bame, Engineering Associate
- Leyi Zhang, Transportation Analyst