“Visualization helps break down complex ideas and make projects accessible.”
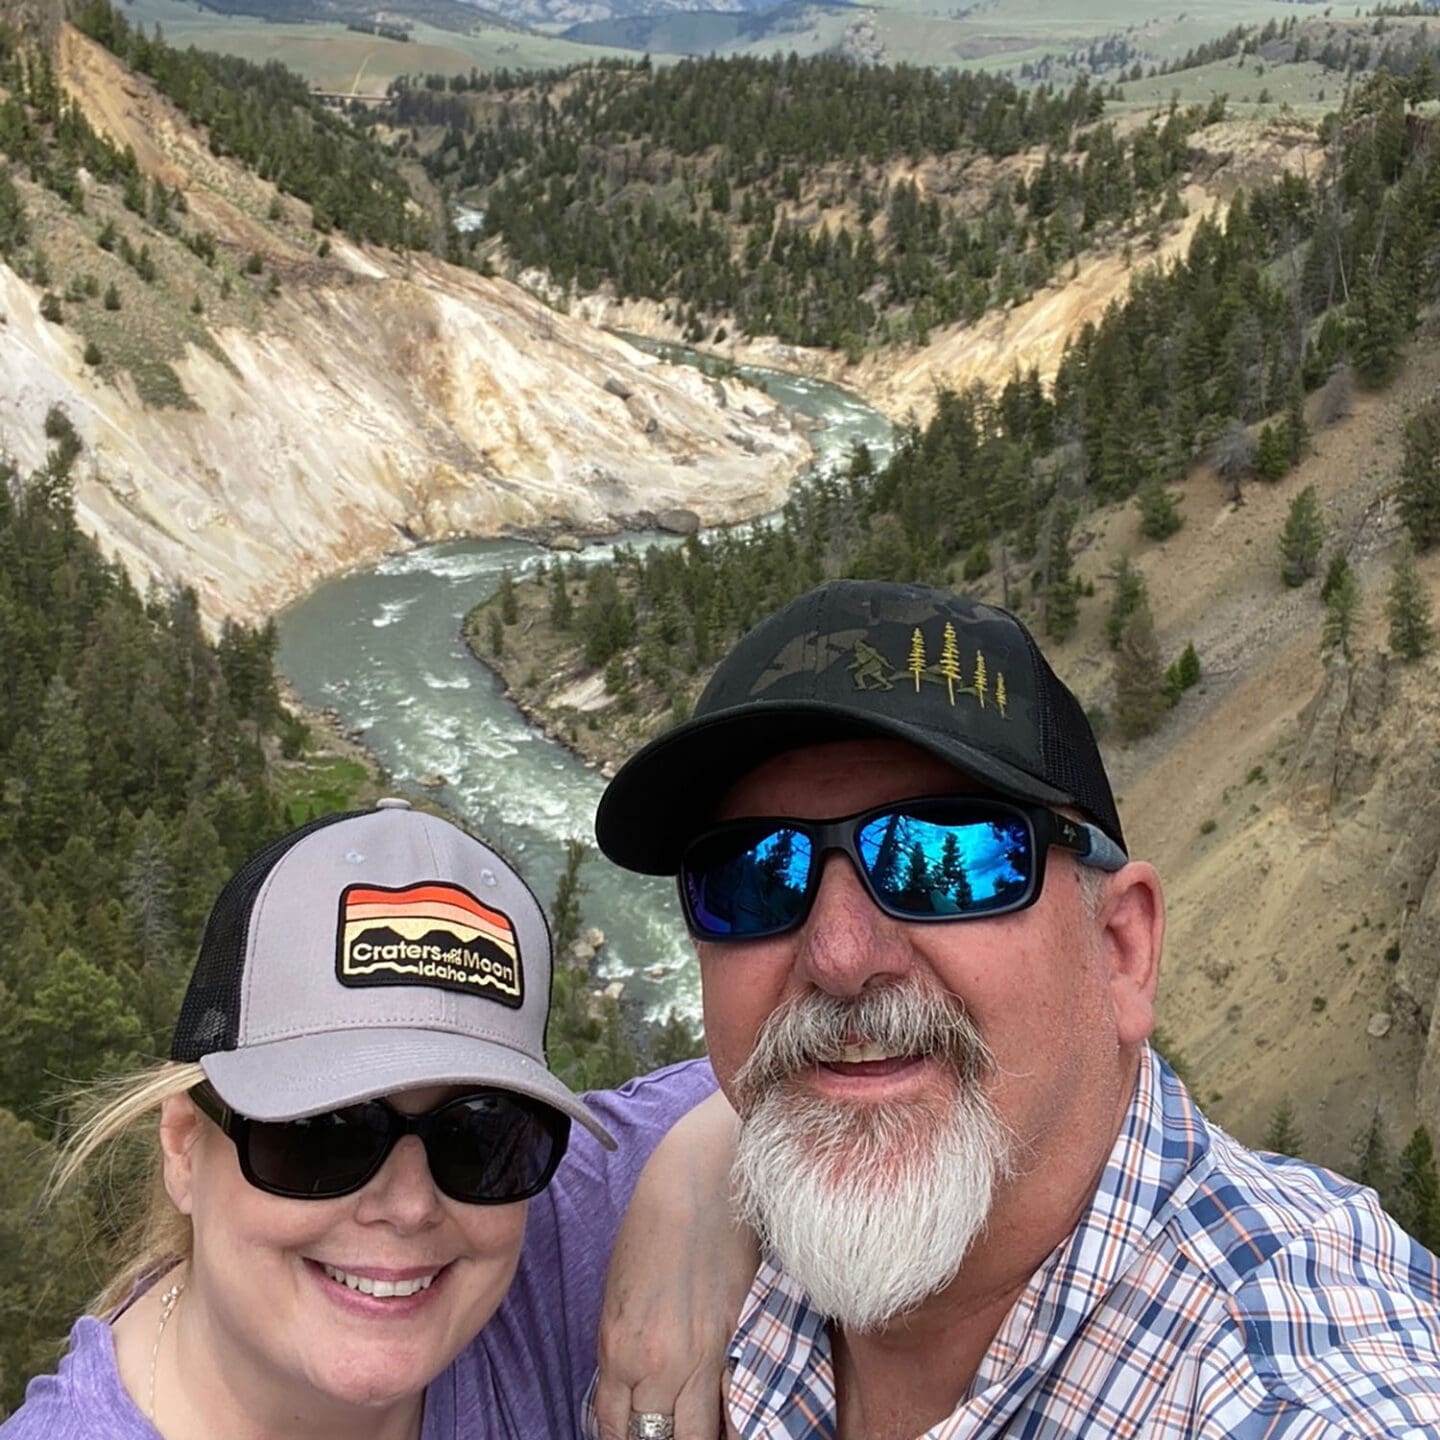
We’re an interconnected nationwide team, but we each have our own reasons for being passionate about the work we do. This month, get to know Steve Rhyne, associate technician in our Spokane office.
What’s your background and how did you end up at Kittelson?
My background has always been in the visual communication arena. It started right out of high school through a program called Regional Occupational Program (ROP), where I became a draftsman and medical illustrator for an R&D company developing total artificial heart devices and heart assist devices. One of my published illustrations even ended up being used, without permission, in a Soviet presentation during the Cold War.
When that company went through a reduction in force, I transitioned into environmental engineering, working first at Dames & Moore and then at Jacobs. My path eventually led me to Fehr & Peers, where I developed my GIS and visualization skills and got introduced to transportation projects. I worked there for over 20 years.
It was during my time at Fehr & Peers that I met Matt Kittelson. When he left to pursue his master’s at Georgia Tech and then joined Kittelson & Associates, he encouraged me to come on board. It took about 10 years of friendly nudging, but I finally joined Kittelson in 2016. I’ve been here ever since.
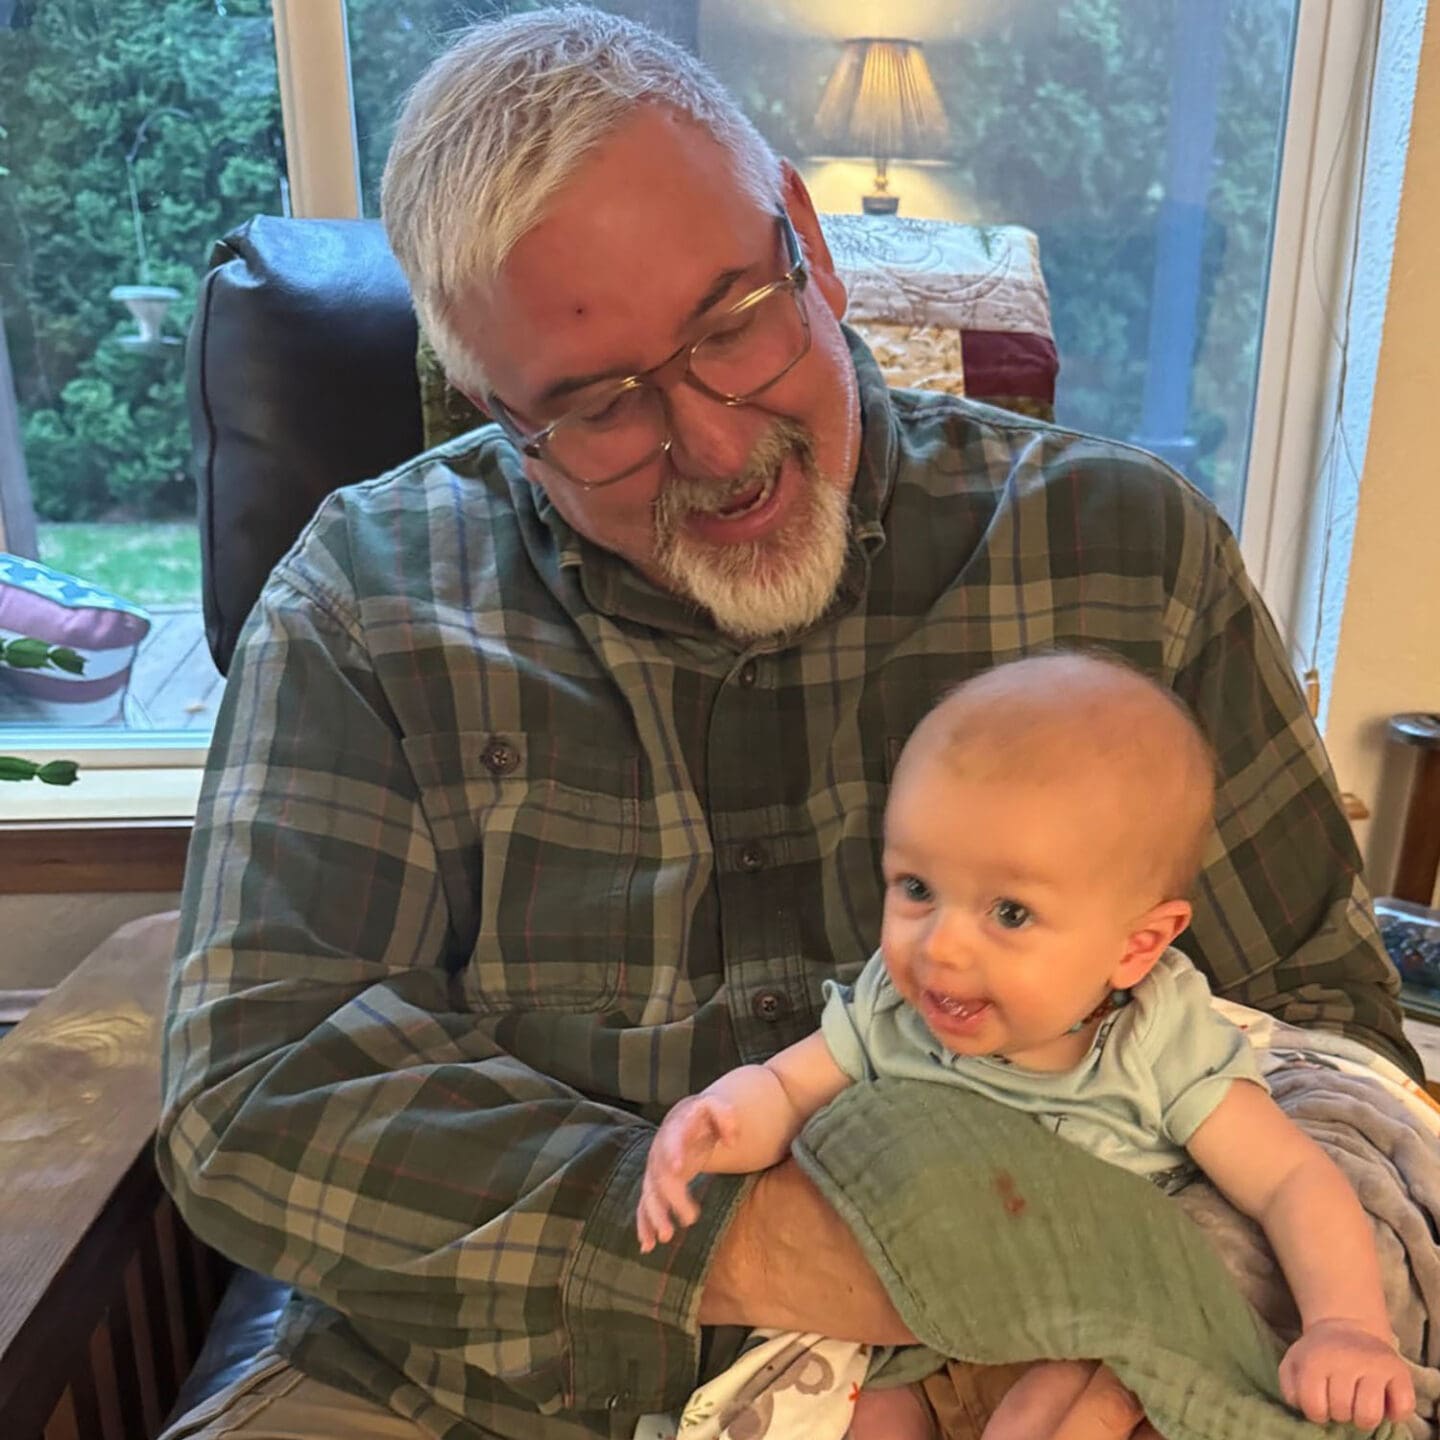
Outsite of work, life is a little slower these days. I spend time woodworking in my garage shop, tending to the vegetable garden, cooking (especially on my smoker or Blackstone), and being a grandparent. I have two grandkids: Taylor, who’s six, and Kane, who’s just about five months old. Being a grandparent has been a real joy.
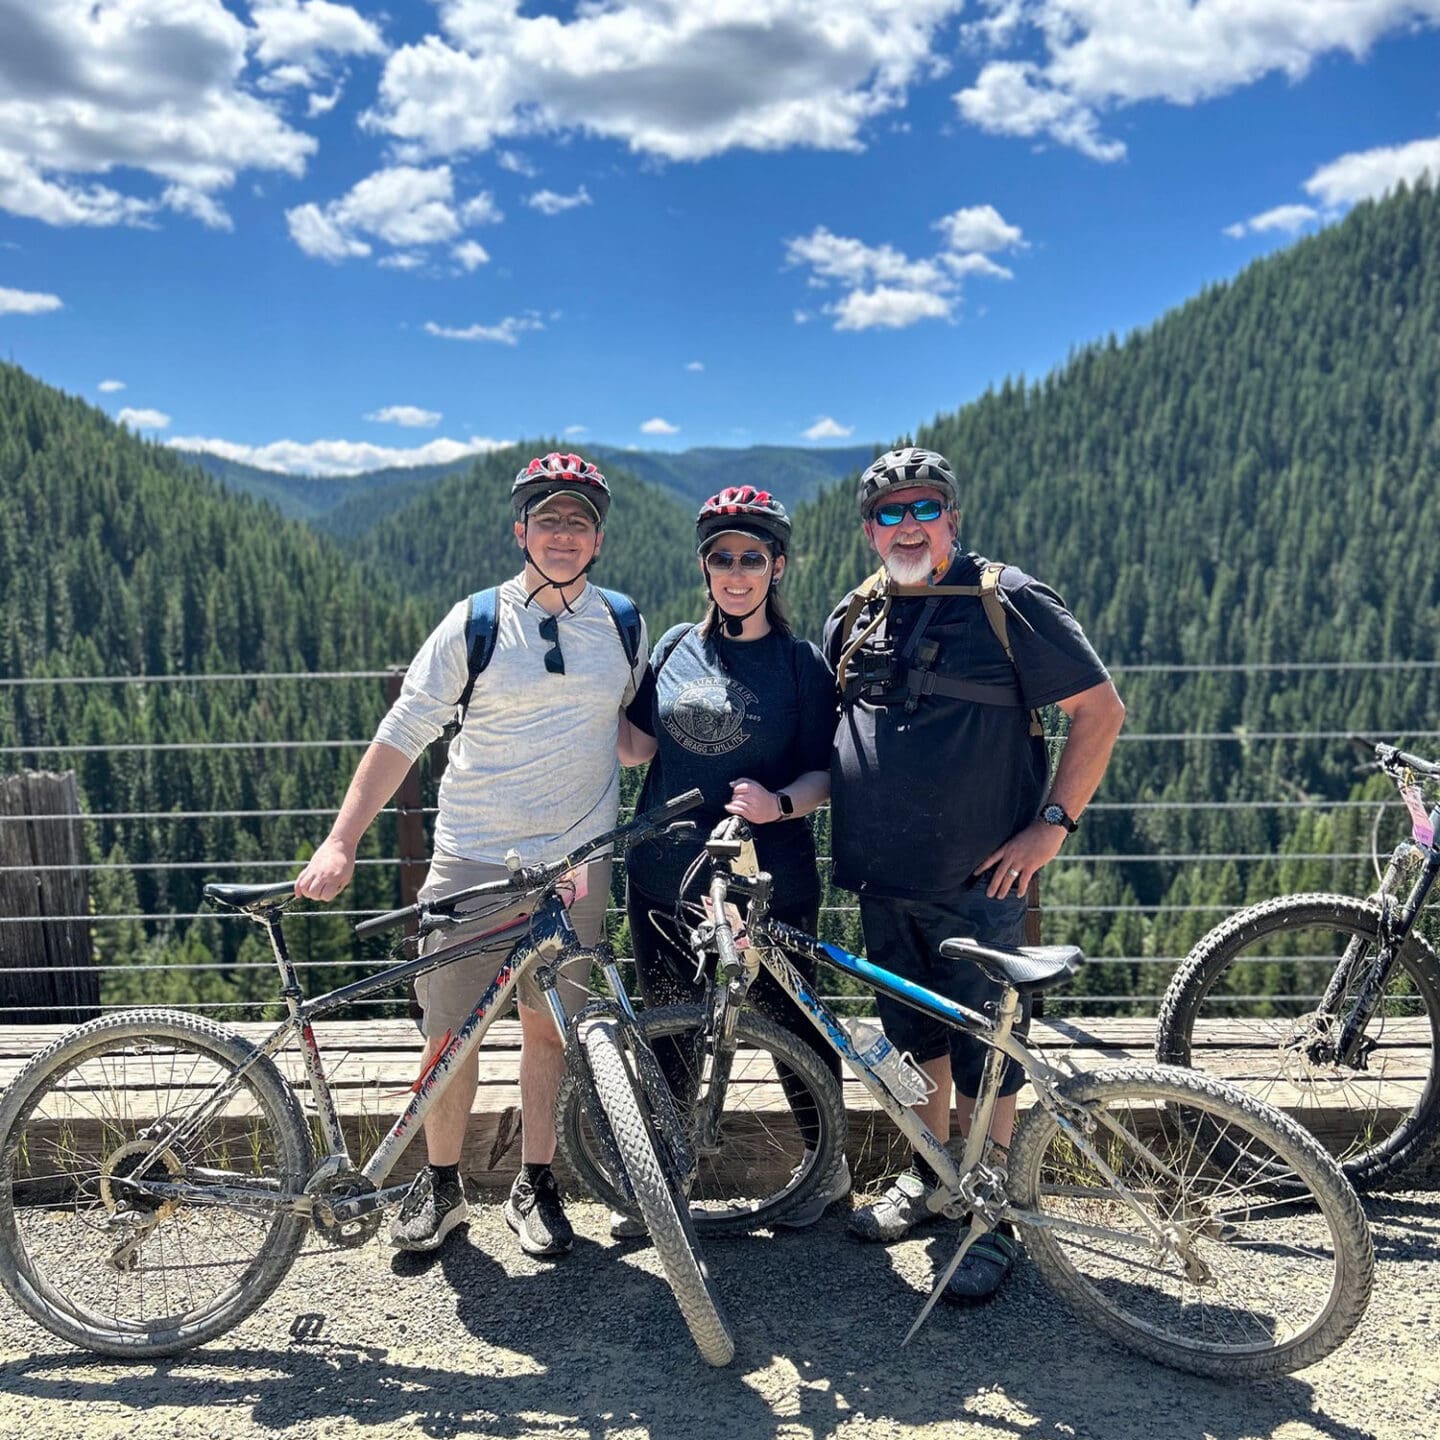
Twenty years ago, you would’ve found me rock climbing, whitewater kayaking, mountain biking, or snowboarding. Life looks a little different now, but it’s just as fulfilling.
What is visualization and what types of projects do you work on?
Visualization can mean a lot of things. It could be data visualization like GIS maps or more immersive 3D visualizations. I love that it’s a broad umbrella. My career has covered everything from medical illustrations to GIS to 3D environments.
My work focuses primarily on 3D visualization. That includes building models for roadway improvements, safety features, or even educational animations that explain things like protected intersections. I also spend time on internal marketing, raising awareness about the power of visualization within the company, and doing R&D, exploring new tools and first-person interaction capabilities that give viewers more control in understanding project designs.
The projects that excite me the most are hybrid projects where GIS analysis supports conceptual design, and everything is communicated through 3D visualization.
A great example is trail planning. We use GIS to identify ideal locations based on various constraints and opportunities. Then we bring that data into 3D to develop potential alignments and visual concepts. It’s a highly visual, problem-solving-driven approach that breaks the mold of conventional project workflows. I think there’s a lot of opportunity to apply this model to other project types.
Another standout project for me was the Alaska Long Range Transportation Plan. It was my first time working on a statewide plan, and Alaska itself presented so many unique challenges. The geography, climate, and remote nature of many communities made it incredibly complex. You can’t fully grasp the scale of Alaska from a map. Some communities require multiple modes of travel to reach, including planes and boats. It was a fascinating learning experience. I gained a deeper appreciation for how transportation systems support everyday life in places that most people will never see. It challenged me creatively and expanded my thinking around accessibility, equity, and logistics in a way no other project had.
Why is visualization so important to transportation projects?
Humans are inherently visual. While some people can absorb information through text or audio, visuals speak volumes. That’s especially important in public involvement, where community members may not be familiar with technical plans or drawings.
Visualization helps break down complex ideas and make projects accessible. One example that stands out is a roundabout project in Kalispell, Montana. There was initial public concern about sight lines, slope, and historical features. But once we created a 3D visualization showing things like horse trailers and school buses navigating the roundabout, and how the design preserved key features, public opinion shifted from skeptical to supportive. Visualization helps build understanding and trust.
What excites you most about the future of visualization?
I’m excited about the direction we’re heading, toward immersive, highly interactive 3D environments. Think Tony Stark in his workshop from the Iron Man movies, manipulating 3D GIS data holographically. That kind of futuristic technology isn’t as far off as it seems.
With advances in digital twin technology and interactive modeling, we’re getting closer to a world where teams collaborate in dynamic, visual spaces. That evolution, where we move beyond static visuals to immersive decision-making tools, is what excites me the most.
Fast Lane Facts
Favorite design tool you can’t live without?
3D Studio Max
Go-to way to get unstuck on a creative challenge?
The Internet. There’s a solution out there for everything.
Favorite font?
Myriad Pro
Dream location to photograph?
I’ve taken many photos in Yosemite, but my dream spot is Coyote Bluff, better known as The Wave, in Arizona.