May 2, 2023
For years, transportation engineers have relied on field visits or manual reviews of video footage to analyze the movements of people walking and biking at intersections to help them identify conflict patterns. This is because collecting accurate pedestrian and bicycle volumes is difficult, and relying exclusively on crash data means waiting for crashes-and the resulting injuries and fatalities-to happen before taking preventative action.
However, manual video review is not a perfect solution either, as sifting through hours of video is time-intensive and thus very inefficient.
Enter the smart intersection. A smart intersection uses technology to document and evaluate how pedestrians, bicyclists, and vehicles interact. Smart intersection tools help us carefully time and analyze user interactions so we can better select, implement, and evaluate countermeasures against conflicts and crashes.
Can video analytics really identify conflicts as reliably as human review? Read on to learn the results of a recent study from the Pennsylvania Department of Transportation (PennDOT), which set out to answer this question.

A smart intersection uses technology to document and evaluate how pedestrians, bicyclists, and vehicles interact.
How Smart Intersections Detect Conflicts
At a smart intersection, computer software scans video footage and identifies interactions between vulnerable road users and vehicles. These interactions are referred to as events.
The severity of an event is measured by post-encroachment time (PET), which is the time between one road user leaving a given point on a roadway and a second road user arriving at that same point. A long PET means the event was likely a safe, conflict-free interaction. A PET of zero seconds means a crash occurred.
For each event, the software program automatically records user speed, location, and movements along with the time of the event and the event’s PET. The software also tabulates information about the speed, movement, and location of each road user, whether they were involved in an event or not, and total volumes by user type.
The goal of PennDOT’s study, led by Kittelson and supported by Imperial Traffic Data Collection, LingaTech, Pennsylvania State University, Rybinski Engineering, and Transoft Solutions, was to understand if computer-reviewed critical events (defined as a PET of three seconds or less) could be used to identify where safety countermeasures are needed, expediting agencies’ abilities to implement safety improvements.
Events were measured using post-encroachment time (PET), which is the time between one road user leaving a given point on a roadway and a second road user arriving at that same point.
Question 1: Can Computer-Reviewed Events Be Used Instead of Human-Reviewed Conflicts?
To explore this question, PennDOT selected 15 intersections across the state that had known crash histories or were recommended by local practitioners based on frequent conflicts. At each intersection, engineers manually reviewed 100 critical events (events flagged by software because of the short PET) and confirmed how many of the events were actually conflicts (based on the involved road users’ proximity, evasive action, and awareness). What we saw was consistent: across 14 of the 15 intersections, an average of 5% of critical events resulted in confirmed conflicts, with a standard deviation of 2%.* This tells us that as a rule of thumb, for every 20 critical events, you can expect one confirmed conflict.
*There was one outlier site-Broad and Washington in Philadelphia-with a higher confirmed conflict rate of 28%, but we hypothesize this is due to the site’s unusually high pedestrian road-user volumes (42%).
We did not observe an increased rate of confirmed conflicts by movement type, surrounding land use, geometric features, or presence of protected turns. This is likely because of the diversity of our sample of intersections compared to the small sample size; further analysis could compare intersections with similar features to better understand the relationship between confirmed conflicts and movement type. However, because the 15 intersections we looked at were so different from one another, this makes the consistency of the 1:20 ratio even more reliable.
Question 2: Do Confirmed Conflicts Predict Crash Patterns?
To understand if critical events can reliably be used to evaluate safety countermeasures, we also needed to understand the relationship between confirmed conflicts and crash patterns-do conflicts predict crashes? At each intersection, our team compared confirmed conflict data to five years of crash data and found:
- The presence of at least one confirmed conflict in a one-week study period indicates you will more likely see a crash at the same intersection within a five-year period.
- About 75% of the intersections with confirmed vehicle-pedestrian conflicts during the one-week study period had a vehicle-pedestrian crash over the five-year study period.
- About 60% of the intersections with confirmed vehicle-bicycle conflicts during the one-week study period had a vehicle-bicycle crash over the five-year study period.
- There is a connection between the location of the crash and the location of the confirmed conflict. If a confirmed conflict was observed in a specific zone at a given intersection, there was about a 60% chance of seeing a crash in the same zone over the five-year study period.
These findings supported a strong correlation between confirmed conflicts and crashes. And because on average, 5% of critical events are confirmed conflicts, this also indicates we can bypass time-intensive human review and instead use critical events identified by video-based event monitoring technology to proactively identify safety issues and make changes.
PennDOT's findings supported a strong correlation between confirmed conflicts and crashes, meaning video review can be used to proactively identify crash patterns.
A Five-Step Process for Using Conflict Data
One of the primary benefits of using video analytics rather than human review is the speed at which it enables agencies to select and evaluate low-cost countermeasures as a first line of defense. If greater improvement is still needed, agencies can quickly respond with additional countermeasures.
PennDOT’s study recommends a five-step process for agencies to use computer-identified critical events to identify patterns and countermeasures:
1. Conduct a one-week conflict assessment between vehicles and vulnerable road users (VRUs).
2. Evaluate the critical events using the following rules of thumb:
- For every 20 critical events, it’s likely one would be deemed a confirmed conflict by an engineer.
- If there are more than 20 critical events at an intersection and the intersection remains unchanged, it is more likely a crash has happened or will happen within a five-year period.
3. If a high critical event count (more than 20) is clustered in an intersection zone, it is more likely a crash will happen, or has happened, in the same zone.
4. Identify, select, and install countermeasures.
5. Conduct another one-week conflict assessment between vehicles and VRUs.
Evaluate critical event data from the “after” period assessment, selecting and installing additional countermeasures if needed.
For a real-life example, let’s turn to an intersection in Bethlehem, PA.
Case Study: Right Turn Flashing Yellow Arrow in Bethlehem, PA
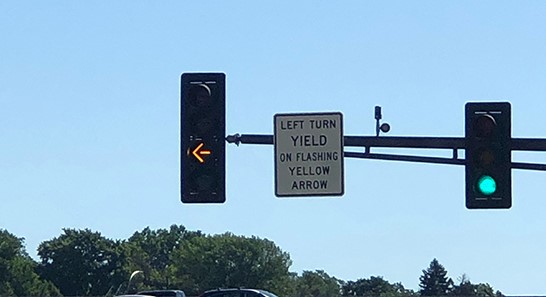 In June 2021, the signalization for northbound right-turning vehicles from New Street to Center Street in Bethlehem, PA was modified to include a flashing yellow arrow along with the standard red, yellow, and green arrows. Following the process described above, we conducted a before-and-after study to determine whether conflict patterns and safety performance changed at this intersection after the installation of the flashing yellow arrow.
1. We conducted a one-week conflict assessment between vehicles and VRUs.
2. We evaluated the critical events flagged by video analytics. In the one-week period, there were 35 pedestrian critical events, 31 bicycle critical events, and 2 confirmed conflicts.
3. In this case, we were evaluating a countermeasure that was selected prior to the collection of “before” data.
4. Approximately six weeks after the installation of the flashing yellow arrow, we conducted another one-week conflict assessment.
5. We evaluated the critical events again. In the one-week period, there were 38 pedestrian critical events and 2 confirmed conflicts, and 18 bicycle critical events and <1 confirmed conflicts.
While the rate of conflicts between pedestrians and northbound right-turning vehicles decreased after installation of the flashing yellow arrow, there was still an elevated count of critical events (>20). Therefore, it is more likely that a resulting crash (or a historic crash) will be present in that zone of the intersection. In light of this, we suggested additional potential countermeasures, including prohibiting right turn on red and a leading pedestrian interval installed in conjunction with the flashing yellow arrow. This is an example of how a before-and-after study can use video analytics to assess the effectiveness of safety countermeasures and proactively recommend improvements.
Intervening Before It’s Too Late
Pedestrians and bicyclists are more likely to suffer serious injuries and fatalities than motor vehicle occupants. It’s critical that our profession develops more efficient measures for predicting safety outcomes for bicyclists and pedestrians and proactively addresses high-risk sites.
Crashes are rare enough that their patterns can be difficult to spot. Critical events, however, happen often enough to reveal recurring issues between vulnerable road users and vehicles. Detecting events that could ultimately result in a crash helps agencies intervene before crashes happen.
PennDOT’s study equips agencies to make use of available technology, using critical events as a surrogate for crashes to create safer conditions for people traveling by bike and on foot. You can learn more about the project here, and if you’d like to discuss the methodology or findings in more detail, don’t hesitate to reach out!