March 15, 2023
In 1950, the original Highway Capacity Manual (HCM) was published with 160 pages. In early 2022, the 7th edition of the HCM was released with nearly 2,500 pages.
Through those 72 years and 2,340 additional pages, the HCM has steadily evolved and grown to include new methods, new transportation modes, and new performance measures. The HCM7 provides methods for evaluating complex roadway geometries for alternative intersections, predicting delays and travel time outcomes from sophisticated traffic signal phasing, and assessing the operational effects of Transportation Systems Management and Operations (TSMO) strategies.
Despite all that evolution in improving the capacity (or “supply”) side of transportation systems, our approach to measuring “demand” in the HCM hasn’t changed much at all. We continue to measure and communicate motor vehicle demand for our streets by looking at the peak hour. In a world where roadside sensors are monitoring traffic volumes 24/7 and automated traffic signal performance measures (ATSPMs) are delivering continuous data feeds, our industry’s standard approach to gathering inputs for capacity analysis remains surprisingly simple:
1. Gather turning movement counts at an intersection during the AM and PM rush hours.
2. Review that data to identify the peak hour (when motor vehicle demand for the intersection is highest).
3. Calculate peak hour level of service, delay, volume-to-capacity ratio, and queues using volumes from the peak hour.
In a world where roadside sensors are monitoring traffic volumes 24/7 and ATSPMs are delivering continuous data feeds, our industry's standard approach to gathering inputs for capacity analysis remains surprisingly simple.
Of course, neither simple nor dated is necessarily bad. However, we have to ask if the status quo is leading to the best outcomes and, if not, how we can improve it. The outcome of measuring demand using the peak hour is, in many cases, an overdesign of transportation facilities, especially if used in conjunction with future-year traffic forecasts. Design decisions based off peak hour estimates tend to overcompensate in favor of cars, creating barriers and unsafe situations for people walking and biking (as well as significant costs for agencies).
Is there a better way? Read on for the solution we’re proposing: a 24-hour capacity framework to help us make more equitable assessments of traffic operations for all modes. This framework is presented in NCHRP Report 1036, Roadway Cross-Section Reallocation: A Guide, and we welcome feedback and discussion to refine it and ultimately get it into industry practice.

Only relying on the peak hour to measure demand can result in an overdesign of transportation facilities, especially if used in conjunction with future-year traffic forecasts.
The Flip Side of the Peak Hour Method
The HCM (as well as AASHTO’s Policy on Geometric Design of Highways and Streets, or “Green Book”) continues to advise using the “peak 15 minutes of the 30th highest hour of the year” to measure demand, arguing that the peak hour represents the most critical period for operations. In other words, roadways are designed to accommodate traffic volumes at the most crowded point of a typical day.
Because of this, a significant amount of roadway capacity goes unused during the rest of the day. The HCM acknowledges that outside of peak periods, traffic volumes are generally much lower than the design hourly volume (DHV). Designing roads for peak hour car traffic is like designing your dining room for Thanksgiving dinner-most evenings, you’ll be eating dinner surrounded by empty chairs.
Designing roads for peak hour car traffic is like designing your dining room for Thanksgiving dinner.
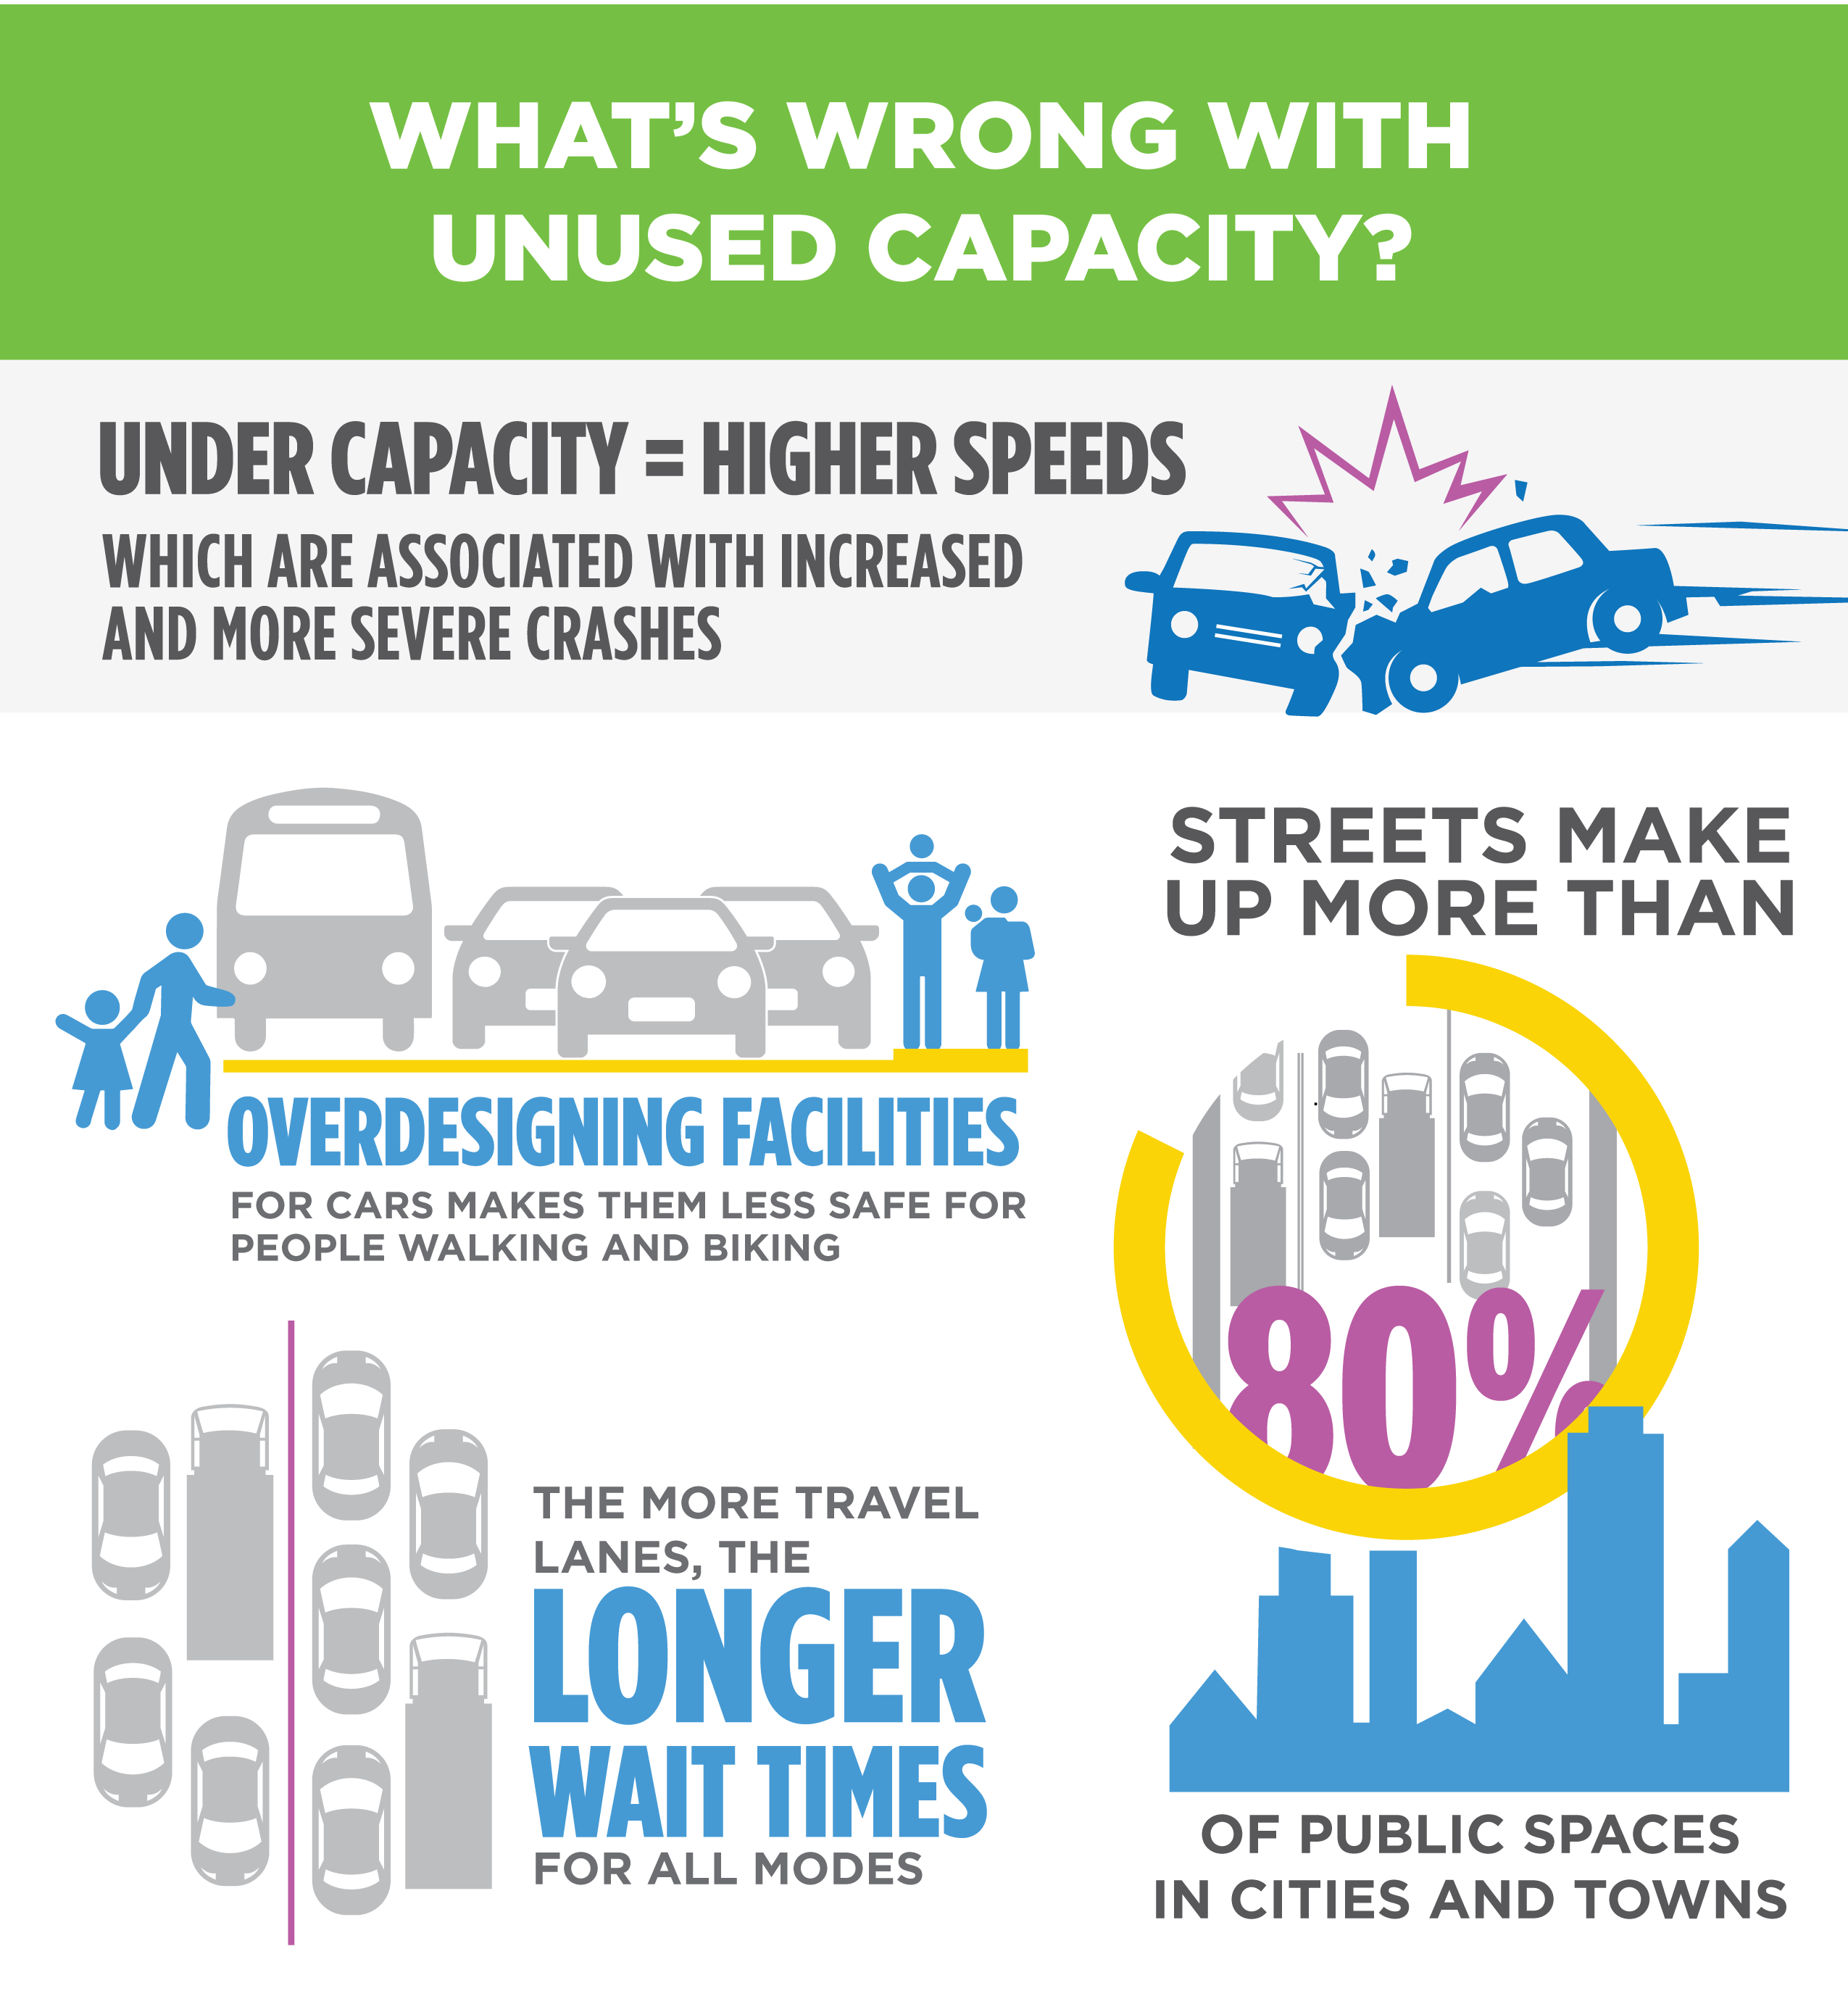
What’s wrong with unused capacity? Perhaps nothing inherently, but here are some important considerations:
-
- A roadway well below capacity is associated with higher speeds, which are associated with increased and more severe crashes. Even with lower posted speed limits, it is well researched and documented that emptier roads are associated with speeding and lower compliance with posted speeds. Along with increasing the risk of crashes, speeding-involved crashes are more likely to result in an injury or fatality.
- Overdesigning facilities for cars makes them less safe for people walking and biking. How do we adjust for capacity? While subtle improvements can be achieved through signal timing and traffic control, macro adjustments come through the construction of additional lanes. Widening an intersection can result in several safety challenges, including increased exposure for pedestrians and bicyclists crossing at the intersection and increased crashes due to the introduction of additional conflict points.
- The more travel lanes, the longer wait times for all modes. Adding lanes to account for peak hour demand leads to increased wait times for all users resulting from increased cycle length and less efficient signal phasing.
- More space for streets means less space for other public resources. Streets make up more than 80% of public spaces in cities and towns. Space used for travel lanes that often sit empty could be repurposed for other transportation facilities like sidewalks and bike lanes, or even other community amenities and resources like parks and housing.
Redefining What It Means to Fail
Everything comes down to tradeoffs. This is the premise behind NCHRP Report 1036, Roadway Cross-Section Reallocation: A Guide, which is currently in the pre-publication stage. Report 1036 presents a step-by-step framework to help planners, designers, and community leaders assess the potential impacts of different roadway space allocation choices-emphasizing the importance of context and community priorities when deciding which tradeoffs are acceptable and which are not. We have been honored to lead the development of this guidebook and are excited to see it applied to rebalance our profession’s definition of a street that effectively serves all of its users.
As engineers, we don’t want to design things that fail. While Level of Service (LOS) “F” doesn’t technically stand for “failure,” it’s been framed that way in our collective subconscious through decades of design decisions aimed at keeping cars moving above all else. Report 1036 puts it this way: “Traditionally, street design decisions have routinely put the needs of drivers first. This habit is so that whether a potential street design ‘works’ is automatically measured against a threshold of vehicle delay that may not even be clearly stated.”
To rethink how capacity can be measured to equitably serve all roadway users, we must move past the idea that having roadway traffic demand exceed capacity for any portion of the day is necessarily a failure. Could it be problematic? On some roadways, certainly. But in others, the benefits to other modes, and especially to safety, could be significant. Differentiating between the two takes a conscious redefinition of what it means for a street design to fail.
Like everything else, safety is a tradeoff. Designing a street to emphasize car mobility might mean allowing speeds at which a crash could result in a fatality. It’s important to recognize that it is a choice to design a street this way. When we start to elevate safety above other considerations in the roadway cross section, the way we make decisions begins to shift as well.
The 24-Hour Capacity Framework
As an alternative to designing roads based on peak hour capacity estimates, NCHRP 1036 introduces an all-day perspective on corridor delay and travel time to help practitioners accurately measure demand and understand tradeoffs. The 24-hour capacity framework accounts for time-of-day effects of travel lane removal and moves beyond the benchmark of whether a project “works” operationally during the peak period.
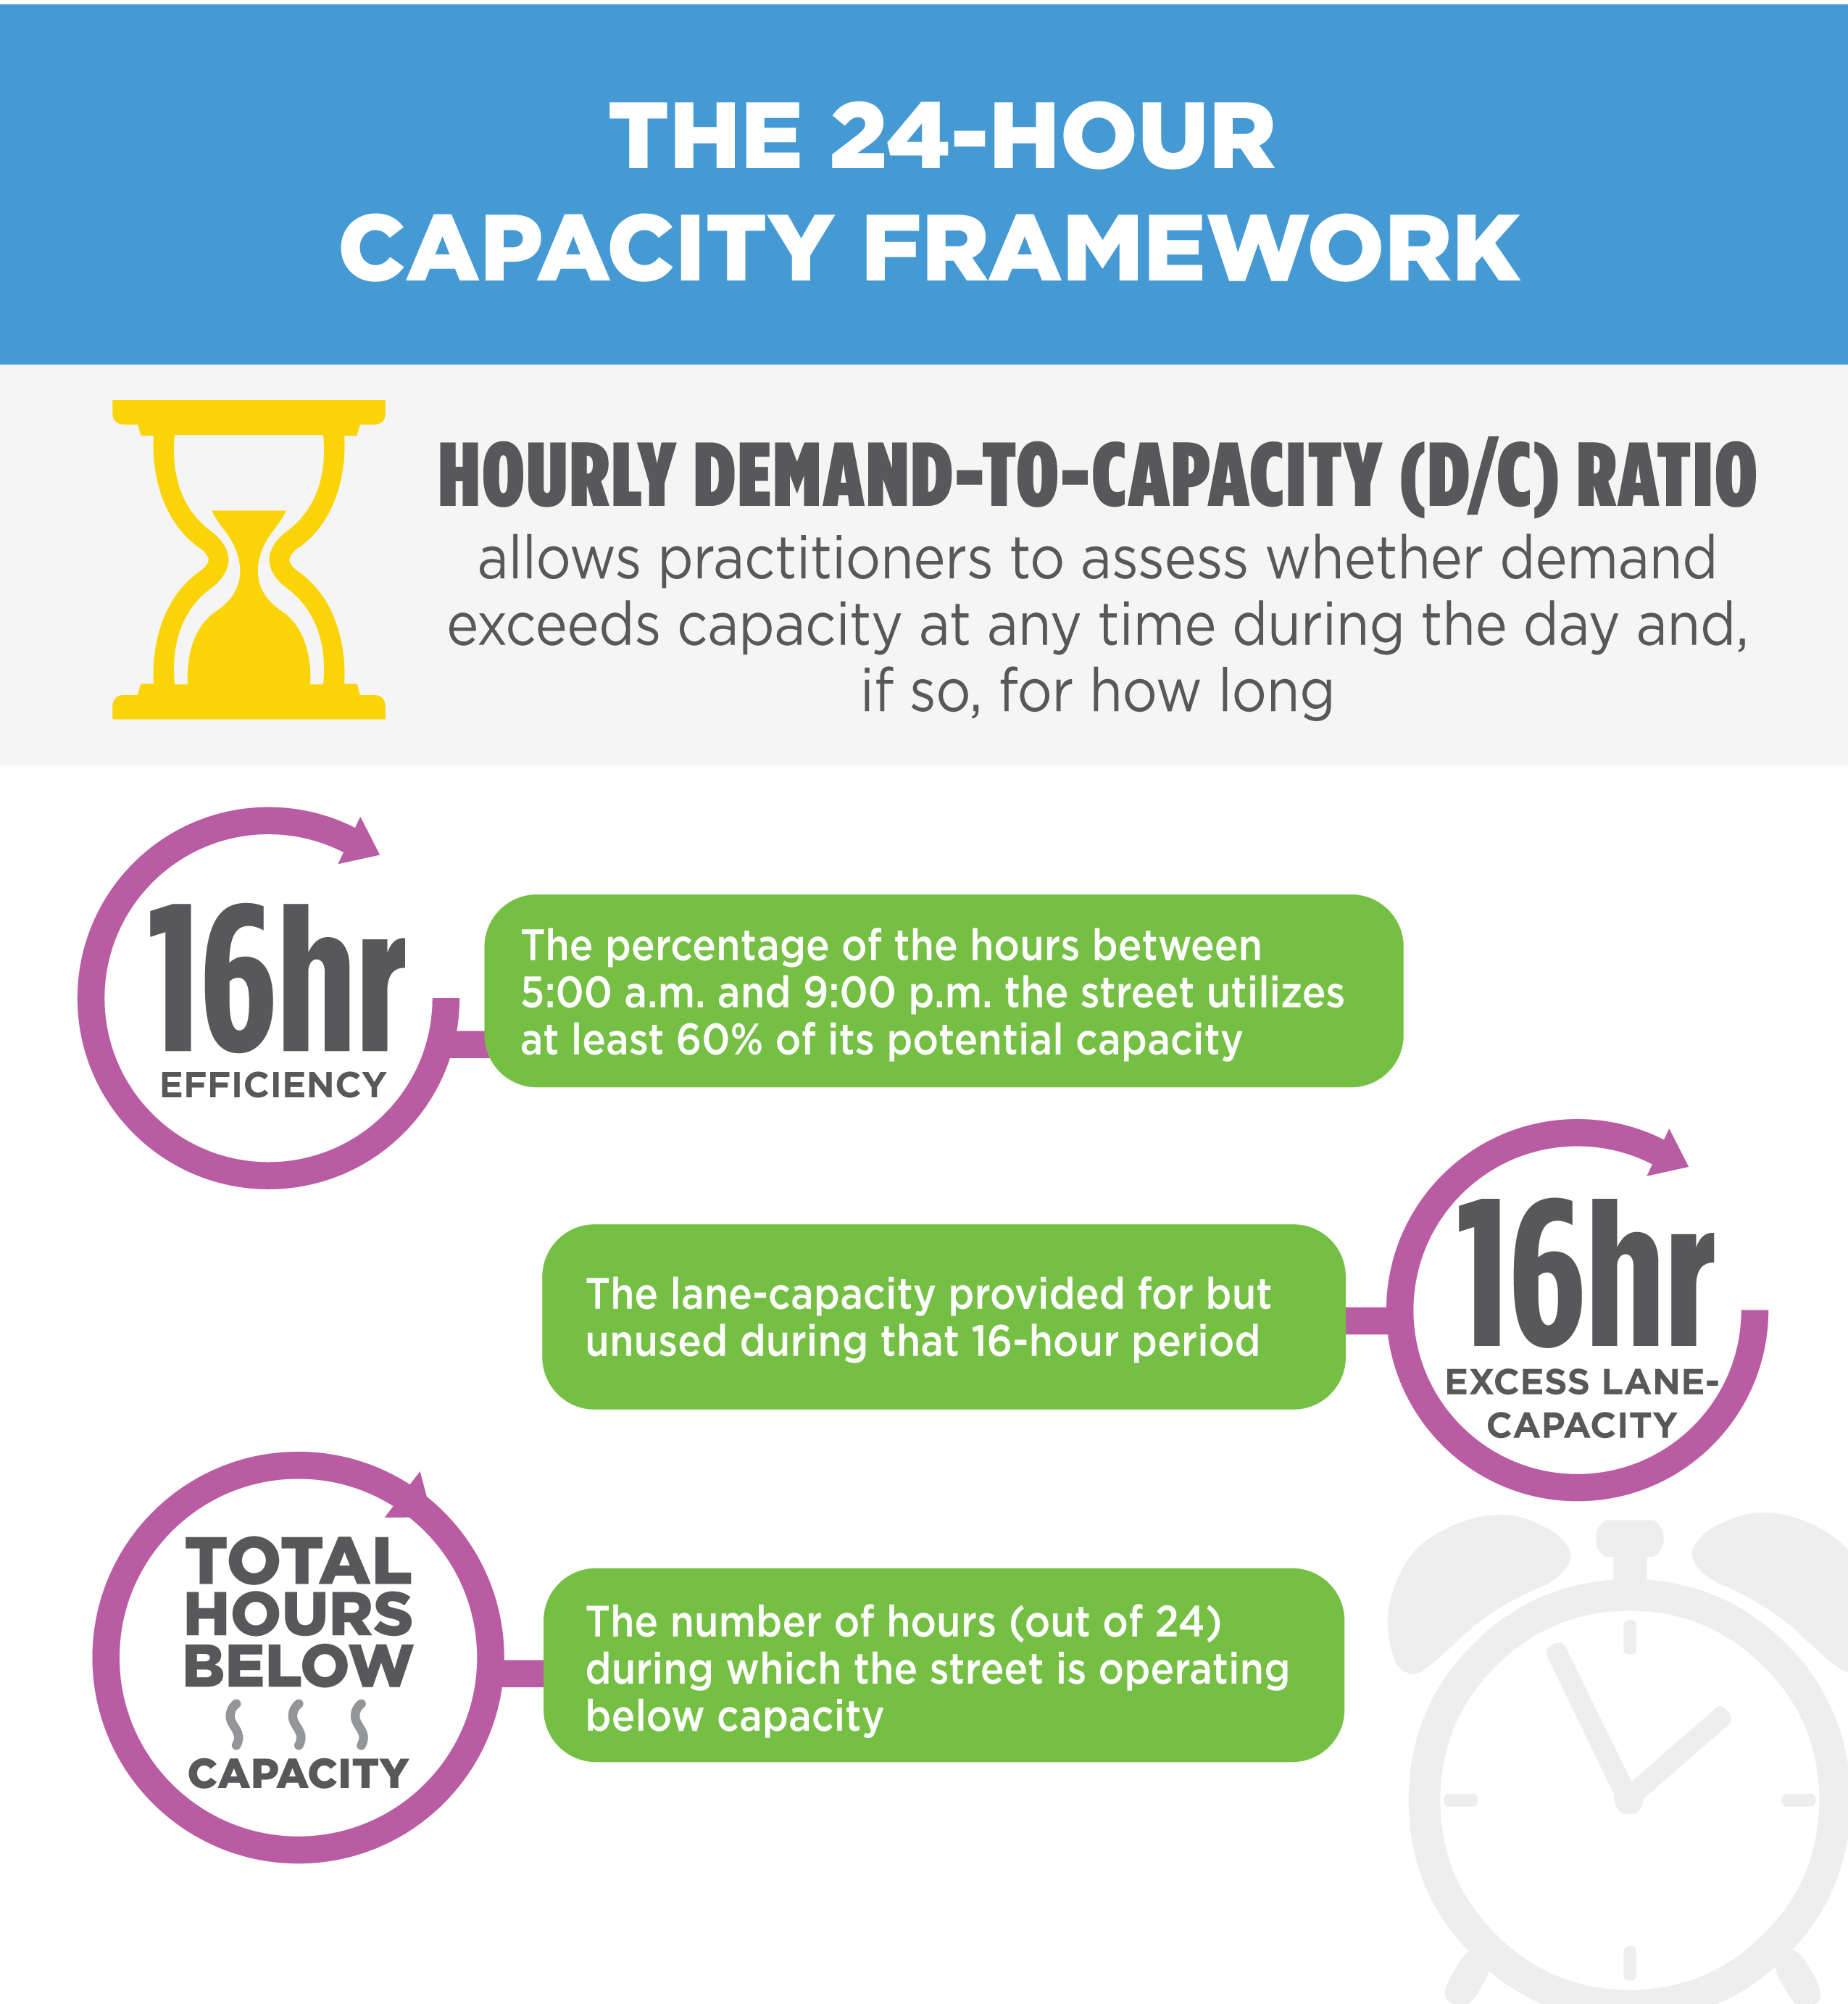
The concept relies on the calculation of unused capacity, using four potential performance measures:
1. Hourly demand-to-capacity (d/c) ratio allows practitioners to assess whether demand exceeds capacity at any time during the day and, if so, for how long.
2. A 16-hour efficiency metric calculates what percentage of the hours between 5:00 AM and 9:00 PM the street utilizes at least 60% of its potential capacity.
3. A 16-hour excess lane-capacity metric indicates the lane-capacity provided for but unused during that 16-hour period.
4. Total hours below capacity refers to the number of hours (out of 24) during which the street is operating below capacity.
These performance measures not only track how often a roadway operates under capacity, but also how far below capacity it is operating. This information is important for weighing tradeoffs and more closely evaluating scenarios at or below operational screening thresholds. This all-day evaluation can aid practitioners in assessing the impacts of design decisions beyond peak periods.
How to Apply the 24-Hour Capacity Framework
Let’s look at an example intersection at which four types of intersection control are being evaluated: a signal with a four-lane cross-section, a signal with a three-lane cross-section, and a signal with a two-lane cross-section, and a single-lane roundabout with a two-lane cross section (one lane per direction). How do we calculate the four performance measures described above?
To calculate the hourly demand-to-capacity (d/c) ratio, we multiply the saturation flow rate(s), the green-to-cycle length ratio, and the number of lanes. Assuming a saturation flow rate(s) of 1,800 passenger cars per hour per lane, our planning-level capacities come out to 1,440 passenger cars per hour (pcph) for the four-lane cross-section, 1,080 pcph for the three-lane cross-section, and 720 pcph for the two-lane cross-section.
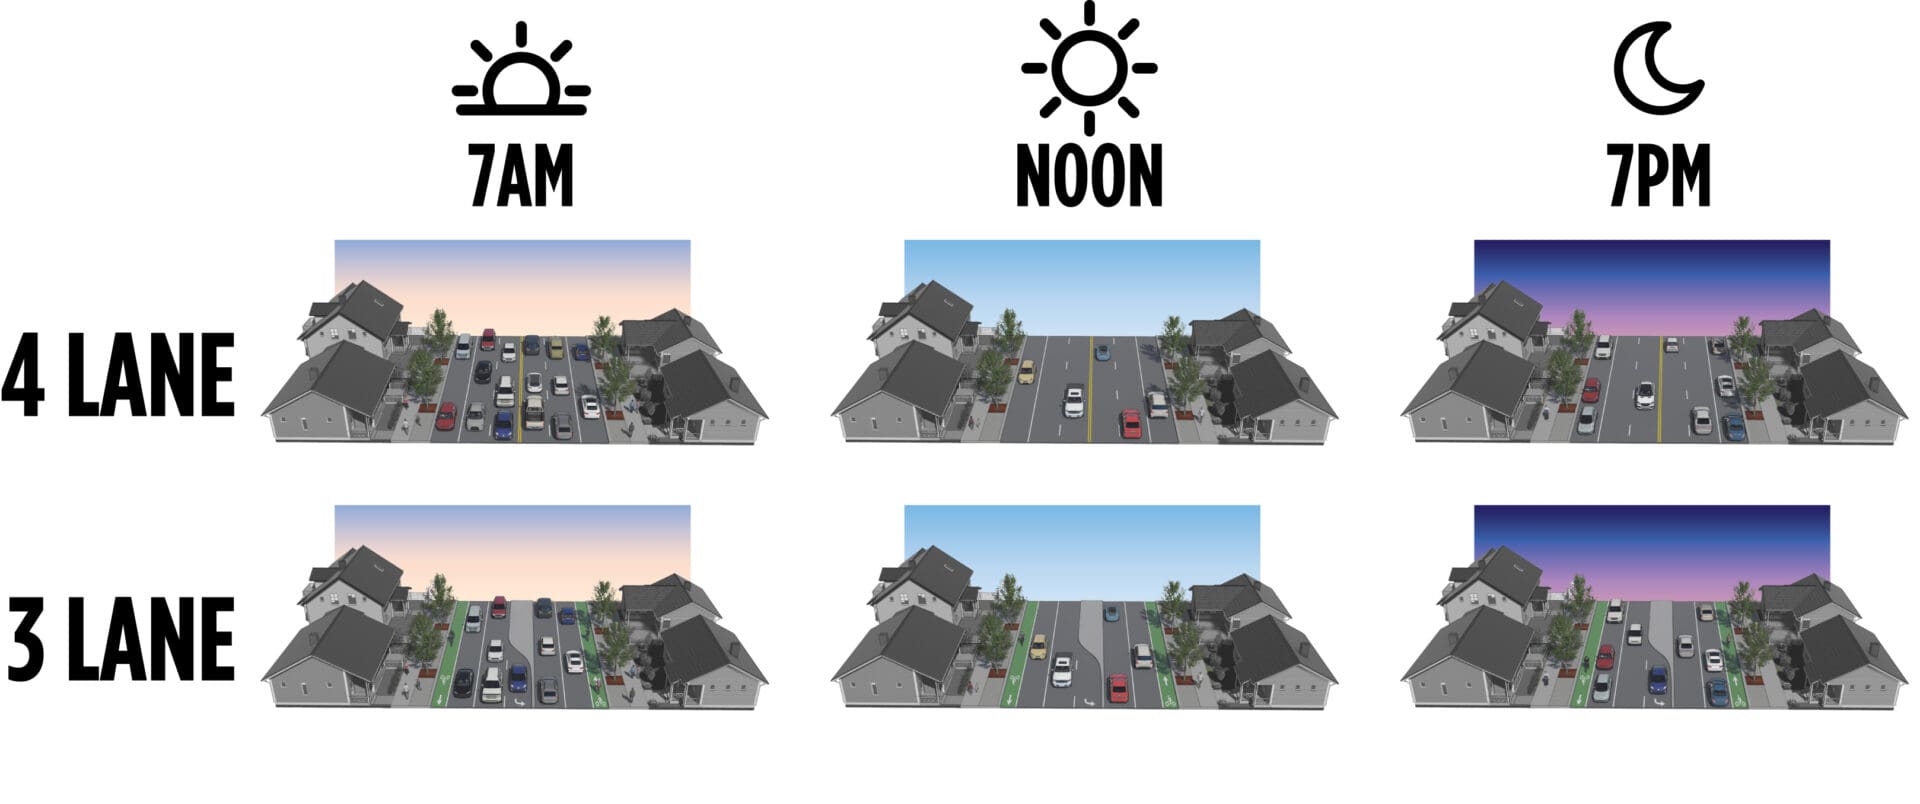
As you can see from this visualization, the four-lane cross-section is the only one in which demand never exceeds capacity-but for three of the four alternatives, demand never exceeds capacity outside of the AM peak period.
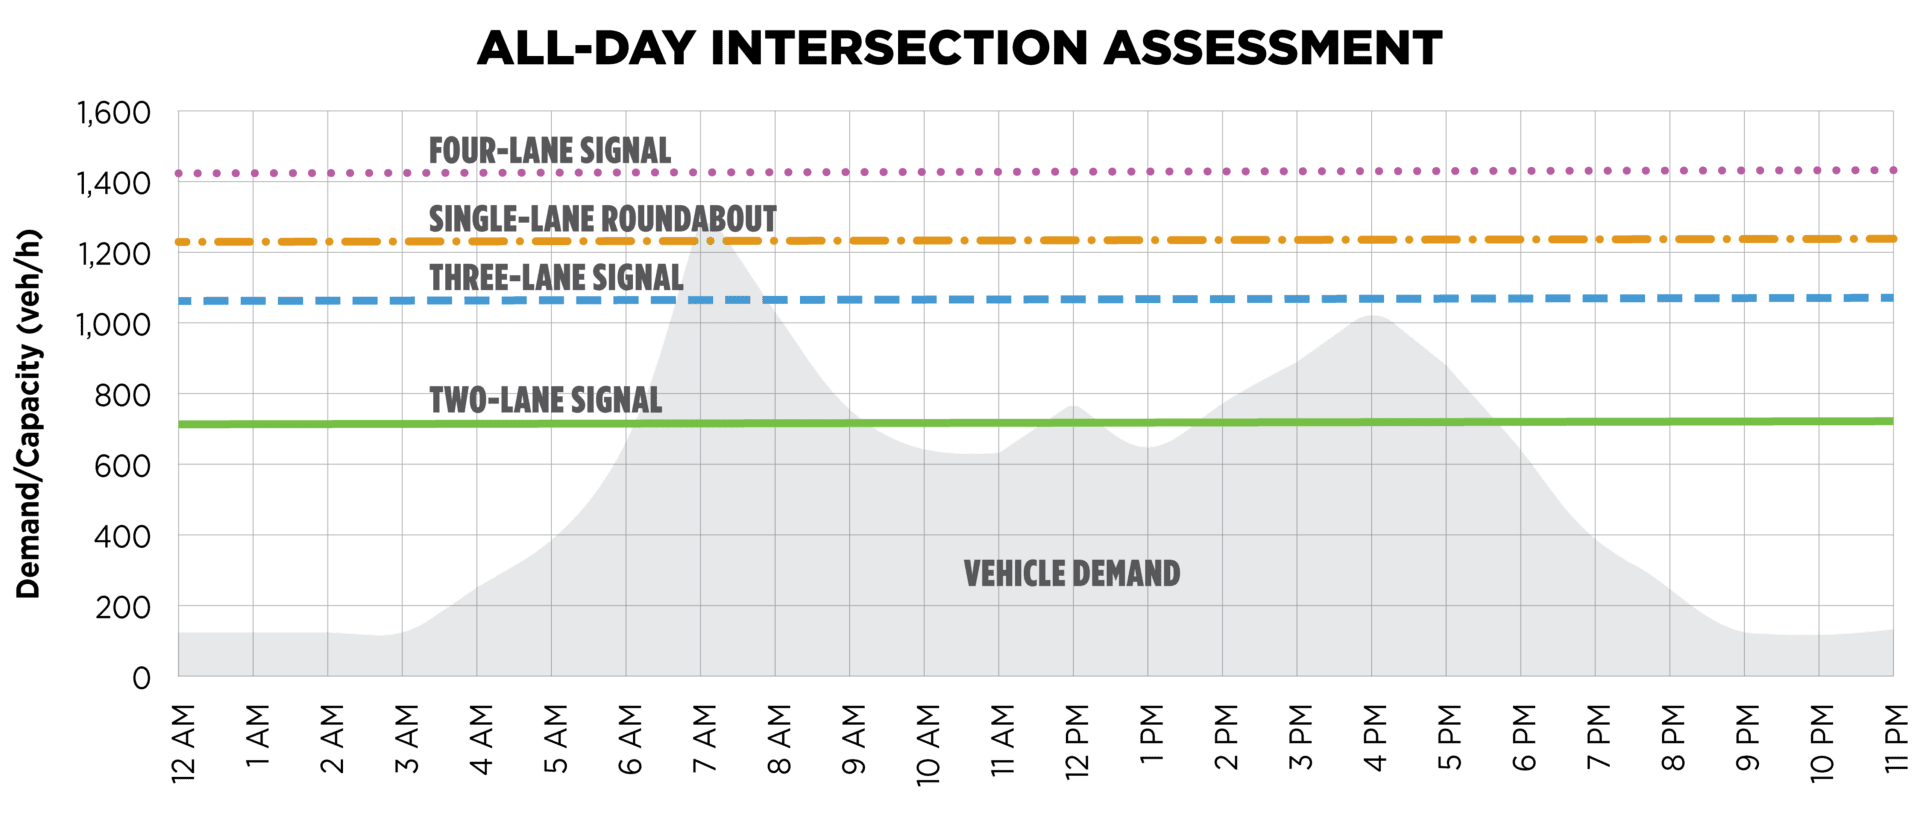
Here’s another way to look at it. Around 7:00 AM, the four-lane cross-section outperforms the others. But the rest of the day, the four-lane cross-section has a lot of unused space. On the other hand, the three-lane cross-section has enough capacity for cars, while better accommodating other modes.
If we finish out this example and calculate the remaining performance measures, we get these results:
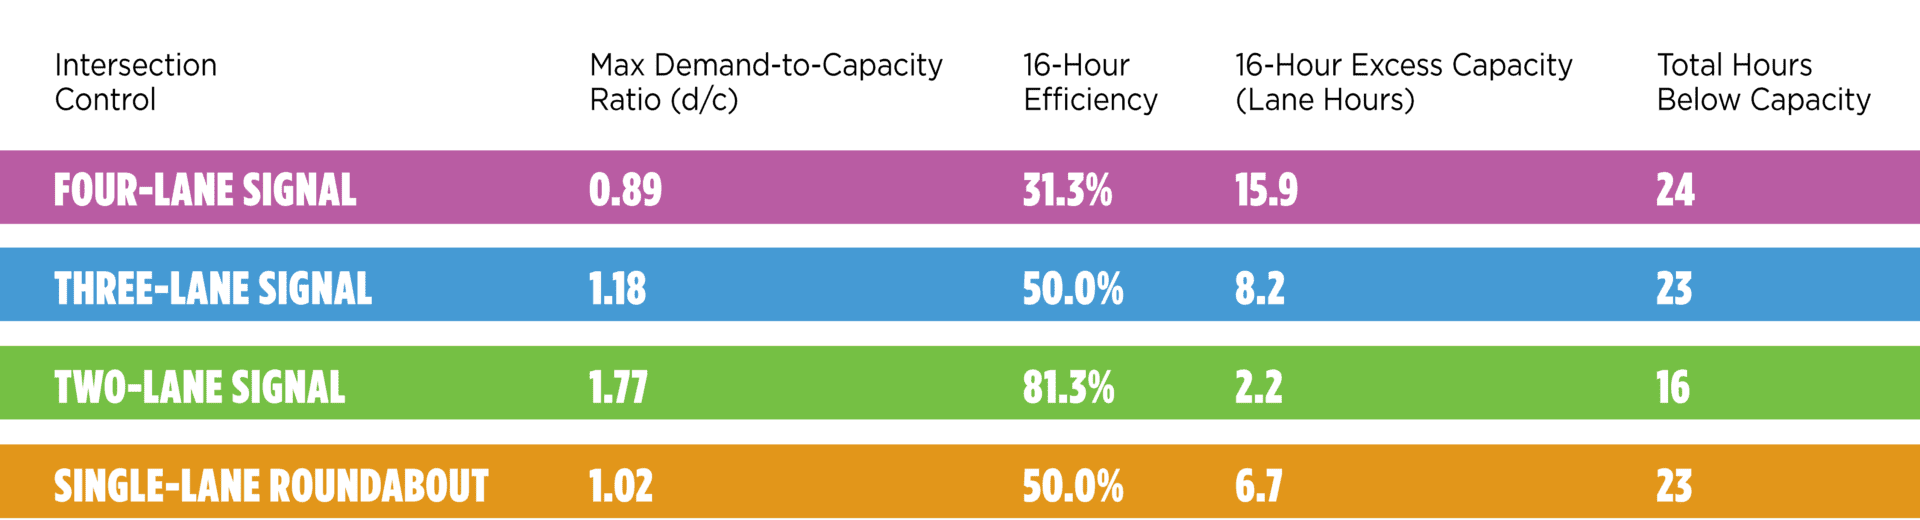
When making design decisions strictly based on the design hourly volume (represented by the maximum d/c ratio column), the four-lane signal alternative is the only viable option, with all remaining alternatives exceeding capacity for at least one of the hours.
However, expanding the analysis framework to include the 16-hour efficiency measure, the same four-lane signal alternative is only 31.3% efficient. It shows nearly 16 lane hours of excess capacity; almost an entire lane is completely empty for 16 hours of the day, even after excluding nighttime hours.
Comparatively, the three-lane signal and roundabout options increase efficiency to 50% (with only about 7-9 hours of excess capacity) and the two-lane signal is 81.3% efficient (with only about two hours of excess capacity).
Finally, the total hours below capacity per day show that while the four-lane signal is below capacity 24 hours of the day, the three-lane signal and roundabout alternatives still show 23 hours below capacity. The two-lane signal is below capacity 16 hours of the day, which also means exceeding capacity eight hours of the day.
Using this information, we can discern that the two-lane signal would result in significant delay for a significant portion of the day (assuming people don’t change their decisions to take another route, travel at a different time, or use a different mode). However, both the three-lane and roundabout options offer satisfactory capacity 23 hours of the day, and generally offer much improved efficiency of the intersection. Expanding the analysis to also include non-operations metrics, the roundabout alternative is likely to quickly outperform signalized alternatives, given safety performance for all modes as well as life-cycle costs.
This is just one example, but it demonstrates how all-day metrics can give us useful information. Solely using the design hourly volume can steer roadway designers to build more space for cars than is arguably needed. Determining which levels of delay are unacceptable based on a broader, all-day picture helps us reach a more thoughtful and informed design decision.
While this article is focused on the vehicle operations measures and specifically the capacity concepts from the HCM, the evaluation of the roadway should take into account a more holistic and inclusive set of measures that includes delay and operations for people walking or biking (these are already in the HCM), as well as safety considerations for all users.
Where This Idea is Going
You can view a pre-publication version of NCHRP Report 1036 here on TRB’s website. Additionally, we welcome more dialogue and perspectives on the 24-hour capacity framework we’ve proposed here. Please email any or all of us with your thoughts, or to set up a discussion-we want to continue evolving the framework, and ultimately see it applied to projects!