
October 21, 2026

Special thanks to Steven Polzin, Research Professor at the School of Sustainable Engineering and the Built Environment at Arizona State University, for his participation in this article. Learn more about Steve’s research on changing transportation demands in his latest TR News article.
Effective transportation planning starts by understanding who is taking what trips, where those trips are to, and how often they are being taken. With this information, agencies can answer questions such as: Do we invest more in public transportation? Do we need to repurpose an old highway? Do we widen the road or improve pedestrian facilities?
When travel demand changes, the assumptions underlying the answers to these questions must change as well.
This is why it’s critical for agencies to examine one of the most significant shifts in travel behavior in the 21st century—the fact that Americans are traveling less.
The American Time Use Survey (ATUS) reported that 2025 daily per capita trip rates were 15% below 2019 levels. It’s tempting to pin this decrease entirely on forces like COVID-19, the rise of e-commerce, and the normalization of remote work, but these explanations miss the fact that trip-making has softening gradually for years, long before any of these forces were in play.
The ATUS data shows 2025 daily trips per capita rates were more than 29% below 2003 levels.
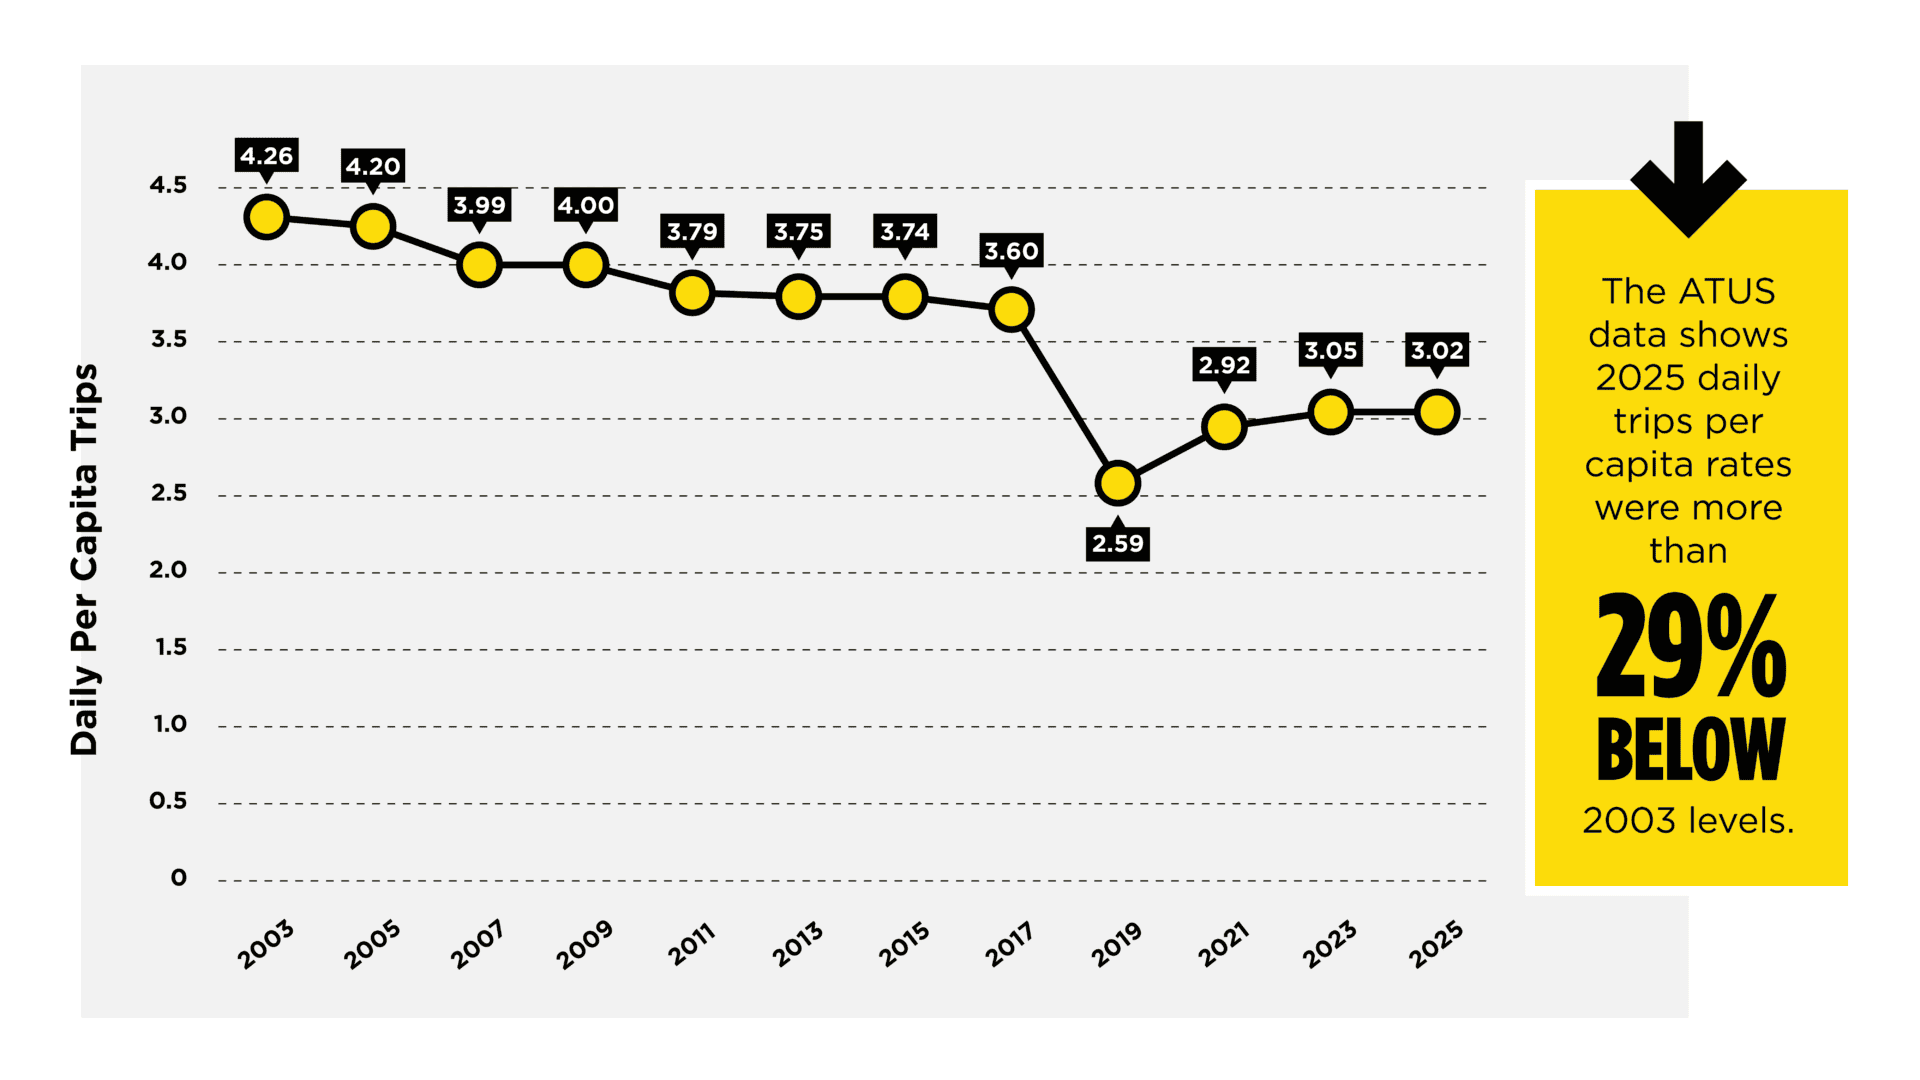
Daily trips per capita rates in the United States from 2003 to 2025. Source: Kittelson & Associates Inc. using data from the 2024 American Time Use Survey
As per-capita trip-making declines, transportation agencies are beginning to recognize the need to reconsider long-held assumptions about future demand, infrastructure needs, transit investments, and system performance. The challenge is not simply understanding why people are taking fewer trips. It is understanding what a lower-trip future means for transportation planning, policy, and investment decisions in the decades ahead.
The End of the Growth Era
Our current reality of softening travel demand comes on the heels of a period of significant growth that dates as far back as the middle 20th century. From 1946 to 1955, the total number of registered vehicles in the U.S. nearly doubled, jumping from about 28.2 million to over 52.1 million. This increase was partly fueled by postwar suburbs, which were designed entirely around car ownership. At the same time, more and more women were entering the workforce, further driving the need for vehicles and travel. As a result, more Americans traveled farther more frequently. Transportation agencies responded accordingly: they began planning for a future in which increased mobility, rising trip rates, and expanding roadway demand were expected to continue.
And for decades, that plan made sense.
According to the Federal Highway Administration, vehicle miles traveled (VMT) continued climbing steadily throughout the remainder of the century, growing an average of 4.22% per year from 1945 to 2005. As congestion increased, planners shifted their focus to keeping pace with the growing demand: adding capacity on existing roadways, investing in highways, and expanding transit systems.
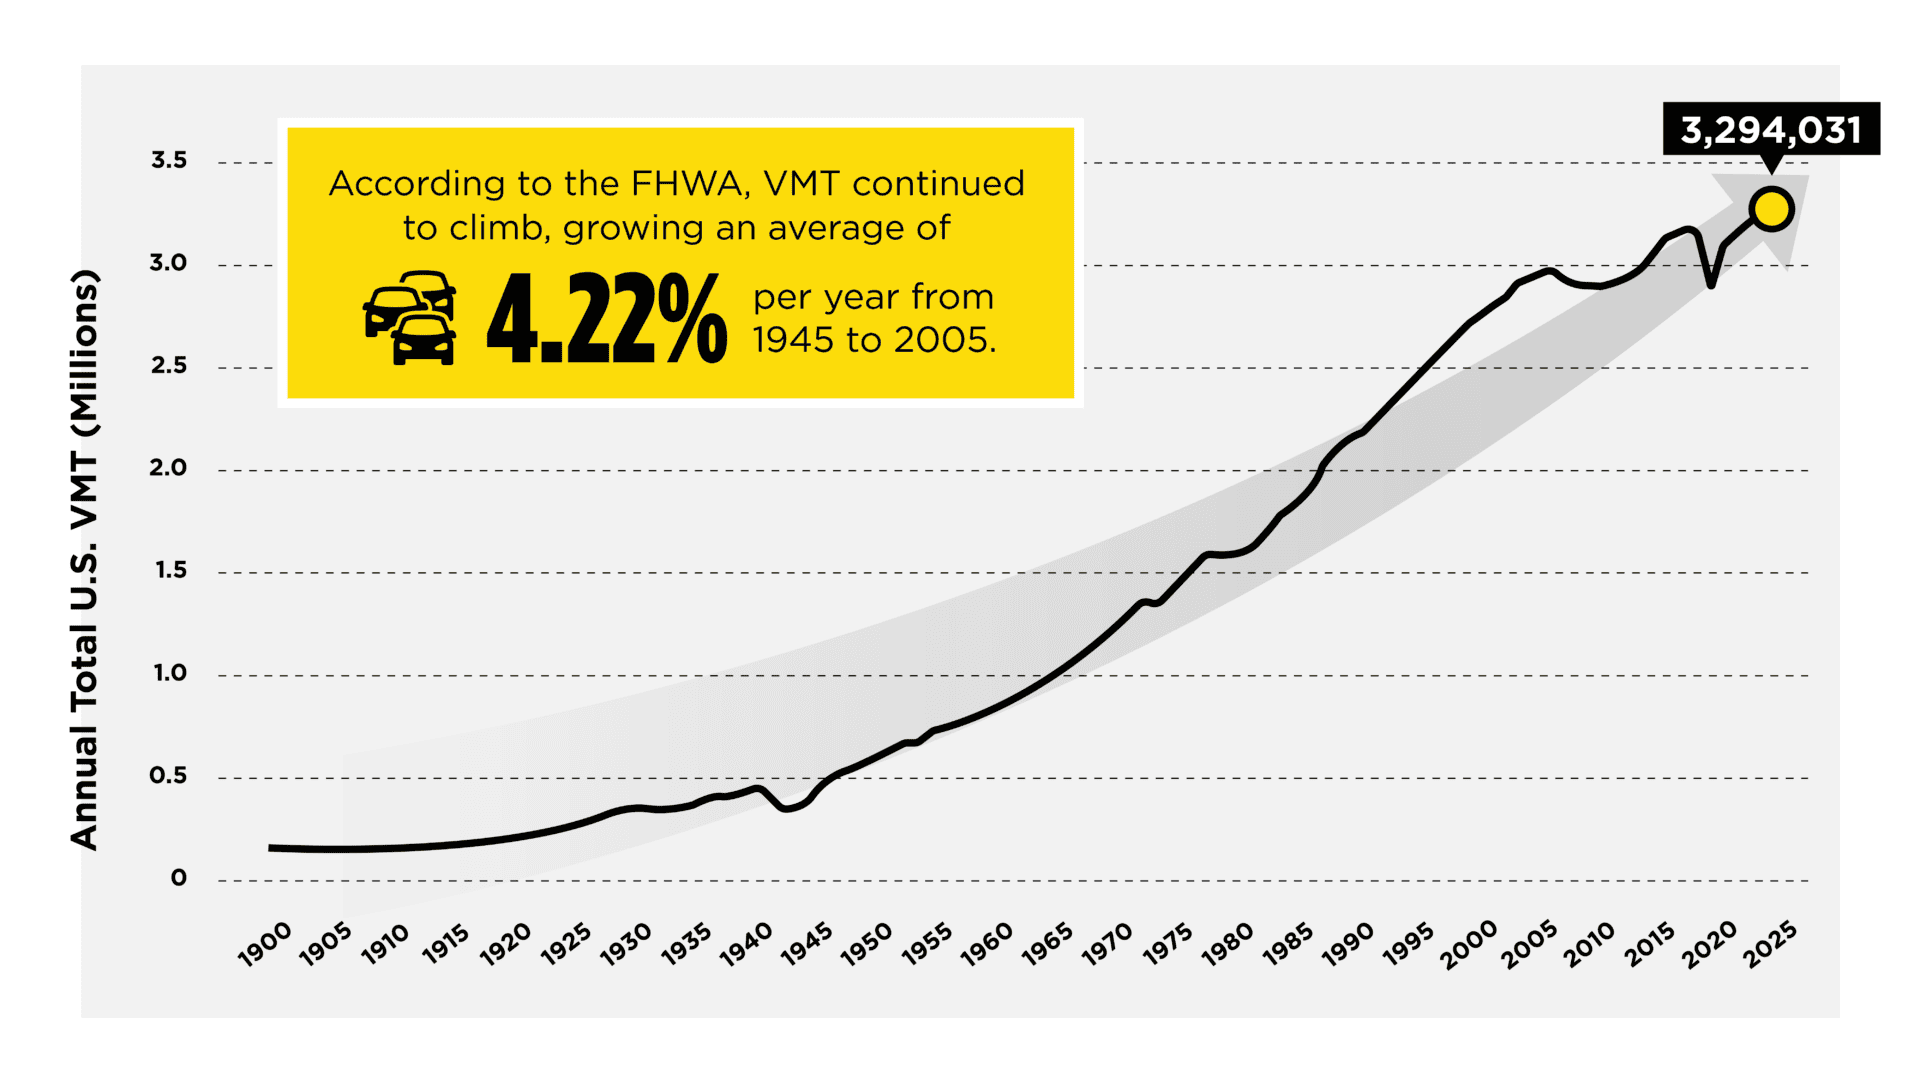
Annual vehicle miles traveled in the U.S. from 1900 to 2025. Source: Kittelson & Associates, Inc. using data from the Federal Highway Administration.
Then, sometime around the turn of the century—not during the COVID-19 pandemic—the trajectory began to change. The National Household Travel Survey found that the per capita trip rate for individuals peaked in 1995 before declining by 22% in 2017. By 2022, the trip rate decreased an additional 34%.
These numbers show that softening travel demand is not, and never has been, a temporary disruption from a fixed public health event. The events of 2020 just accelerated existing behaviors. More people began working remotely. More people began relying solely on online services. More people prioritized digital communication. But the underlying shift had already been there. The pandemic intensified changes that had been gradually taking place for years, aided by the expansion of communications and computing capabilities.
A Broad Trend Across All Modes, Places, and Travelers
What’s fascinating about this decline in trip demand is that it isn’t limited to a single mode, geographic location, or demographic. It can be tempting to assume that fewer trips are the result of younger generations driving less, urban residents embracing alternative transportation options, or workers commuting less frequently after the pandemic.
But no matter how you sort the data—whether by age, income, education, race, ethnicity, or geography—the trend remains remarkably consistent: people are making fewer trips than they did two decades ago. For example, the data from ATUS tells us:
- Walking travel time decreased by about 38% from 2003 to 2025, while transit travel time declined roughly 33% during the same period.
- While adults aged 15–19 experienced the largest decline in daily trips (decreasing 40% between 2003 and 2025), all other age groups saw a decline of at least 20%.
- Between 2003 and 2025, daily trips fell by roughly 28% to 40% for every group analyzed (Black, Asian, White, and “Other”).
- Urban households saw a 27% decrease in daily trips between 2003 and 2025; rural households experienced a decrease of approximately 34% during that same time.
If declining trip rates were confined to a specific demographic group or tied solely to pandemic-era disruptions, planners could reasonably expect demand to rebound over time. Instead, the decline has been observed across age groups, income levels, educational attainment, and geographic contexts. That breadth and persistence suggest the trend is being driven not by a single cyclical factor, but by multiple structural changes that have altered how Americans carry out daily activities.
However, it’s important to note that travel demand is not immune to long-term cycles. Periods of expansion can be followed by periods of contraction, and future economic, technological, or social changes could once again increase trip-making. But the factors associated with the current decline (digital substitution, changing work patterns, e-commerce, and shifting household behaviors) have generally reduced the need to travel rather than merely suppressing it temporarily. Unlike short-term disruptions, these changes have become embedded in everyday life and continue to evolve in the same direction.
That fact coupled with the available evidence points less toward a return to historical trip rates and more toward the emergence of a new baseline in which Americans accomplish more activities with fewer trips.

With the rise of e-commerce, many household trips have been replaced with delivery trips. Source: Adobe Stock
Travel Is Changing—Not Disappearing
Yes, Americans are making fewer personal trips. But it does not mean transportation demand has disappeared. In many instances, travel is shifting from household trips to business trips.
For example, consider an activity that once required multiple trips: you’re throwing your child a birthday party. You go to the grocery store for food, the post office to mail invitations, and the party store for balloons and decorations. Now, you can have groceries delivered, send invites electronically, and schedule the balloons and decorations to arrive on the morning of the party for convenience.
The activity still occurs, but the personal trips associated with it are removed and replaced with business (delivery) trips.
The same pattern can be seen across countless daily activities: online shopping, mobile banking, home repair services, rideshare trips, new pet services, and on-demand household assistance continue to reduce the number of trips made by individuals while increasing the number of trips made by commercial and service vehicles. Online retail sales represented only about 2.5% of total retail sales in 2005. By 2020, Federal Reserve Economic Data shows that share had climbed to roughly 11%, and by 2025 it had approached 17%, surpassing its prior COVID-era peak.
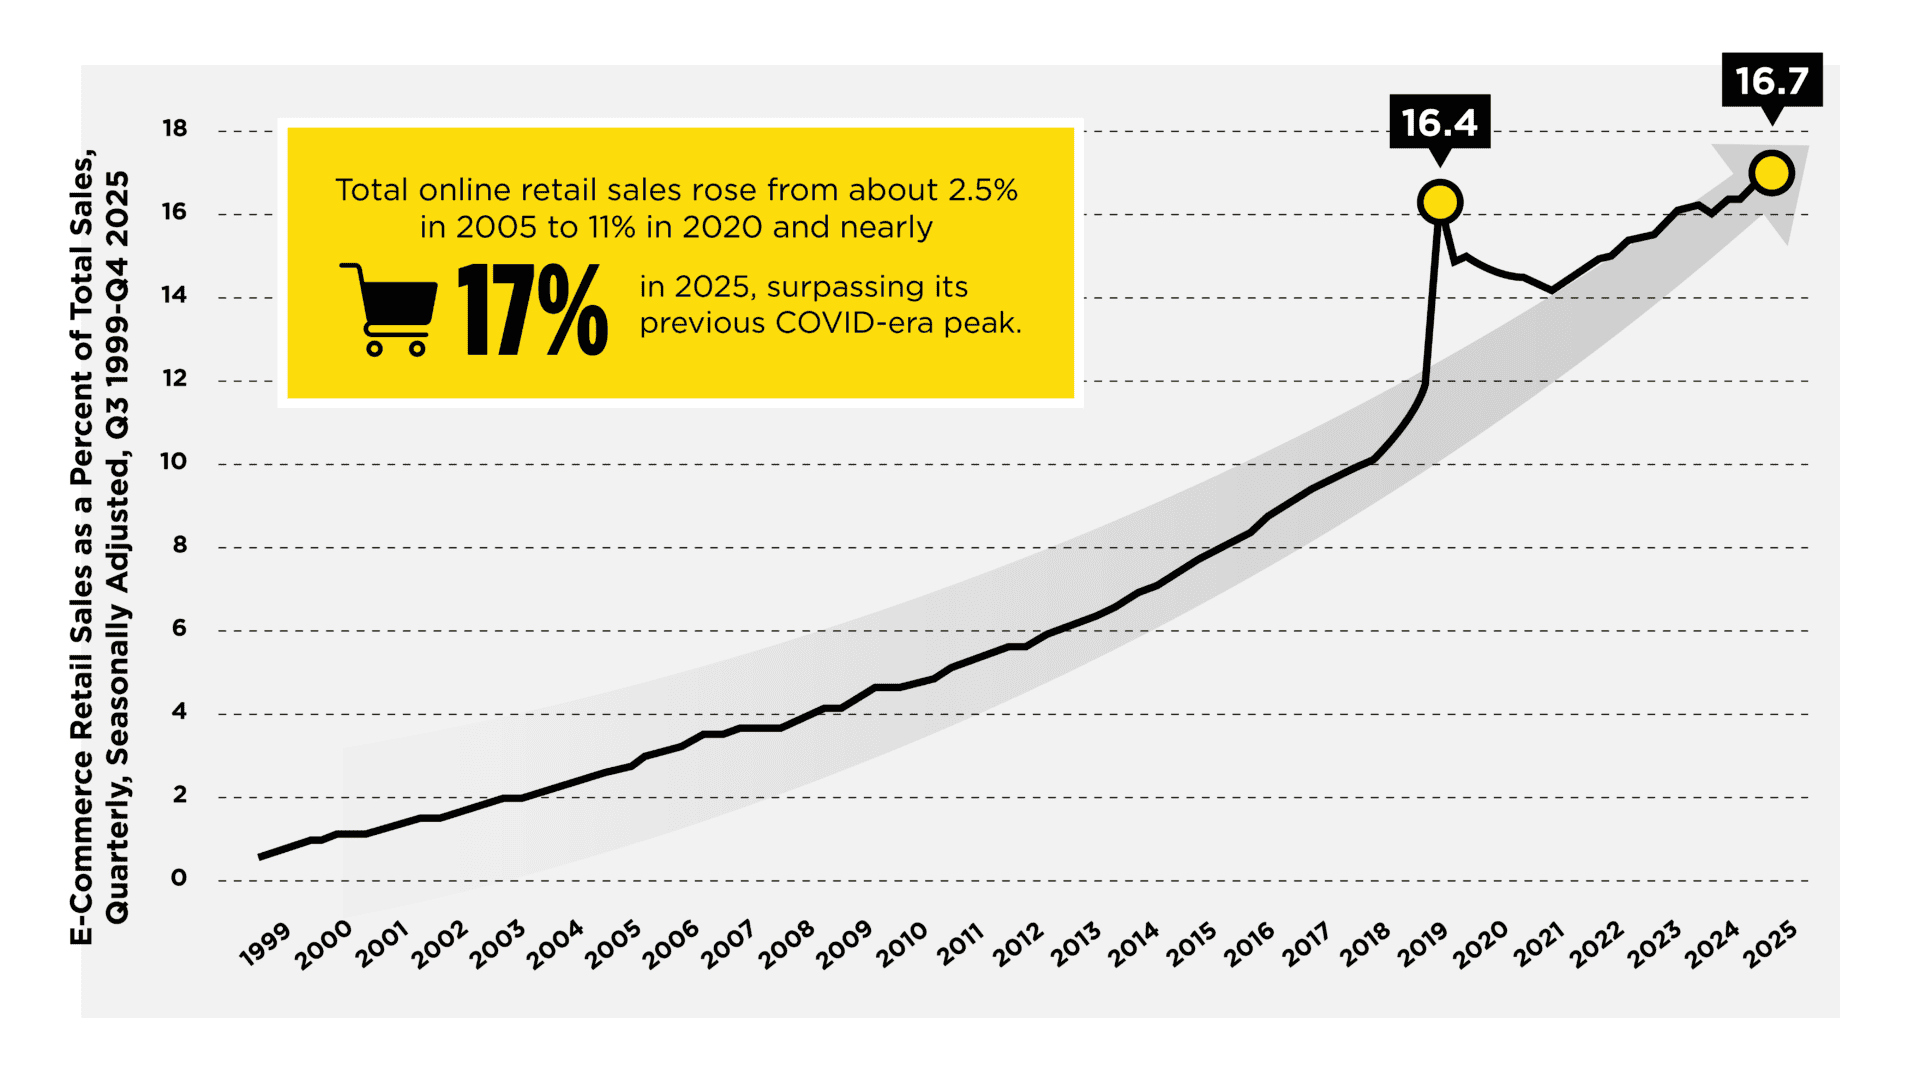
E-commerce retail sales as a share of total U.S. retail sales increased from 1999 to 2025. Source: Kittelson & Associates, Inc. using Federal Reserve Economic Data, Federal Reserve Bank of St. Louis
Now, we must do more than shift our thinking about how many vehicles are on the road. We must also think about what is actually moving on the transportation system: rather than a deluge of individuals traveling to conduct their daily activities themselves, we increasingly have freight movement, deliveries, service calls, and commercial operations performing these labors in batches. These two types of travel impact a transportation system differently:
- A delivery vehicle cannot always shift to transit.
- A contractor transporting tools and materials has different route, parking, and scheduling needs than a commuter.
- Freight and service vehicles place different demands on roadway infrastructure, curb space, and traffic operations.
Understanding this shift will be critical as agencies evaluate future roadway demand and infrastructure investment priorities.
What Less Travel Means for Transportation Planning
For transportation agencies, declining trip-making challenges the foundational assumption that has guided planning for decades: that future demand will be greater than current demand.
In response to this challenge, planners and agencies must:
1) Rethink future demand forecasting. Traditional forecasting models have relied heavily on population growth, employment, household formation, and historical travel behavior. Those variables remain important, but they no longer fully account for technologies and services that can eliminate trips altogether. Planning for future demand increasingly requires understanding virtual activity, service delivery, telework, and other forms of travel substitution.
2) Identify new opportunities. If future transportation needs are not driven solely by increased travel demand, agencies may have more flexibility to focus on other priorities, such as making existing infrastructure work better.
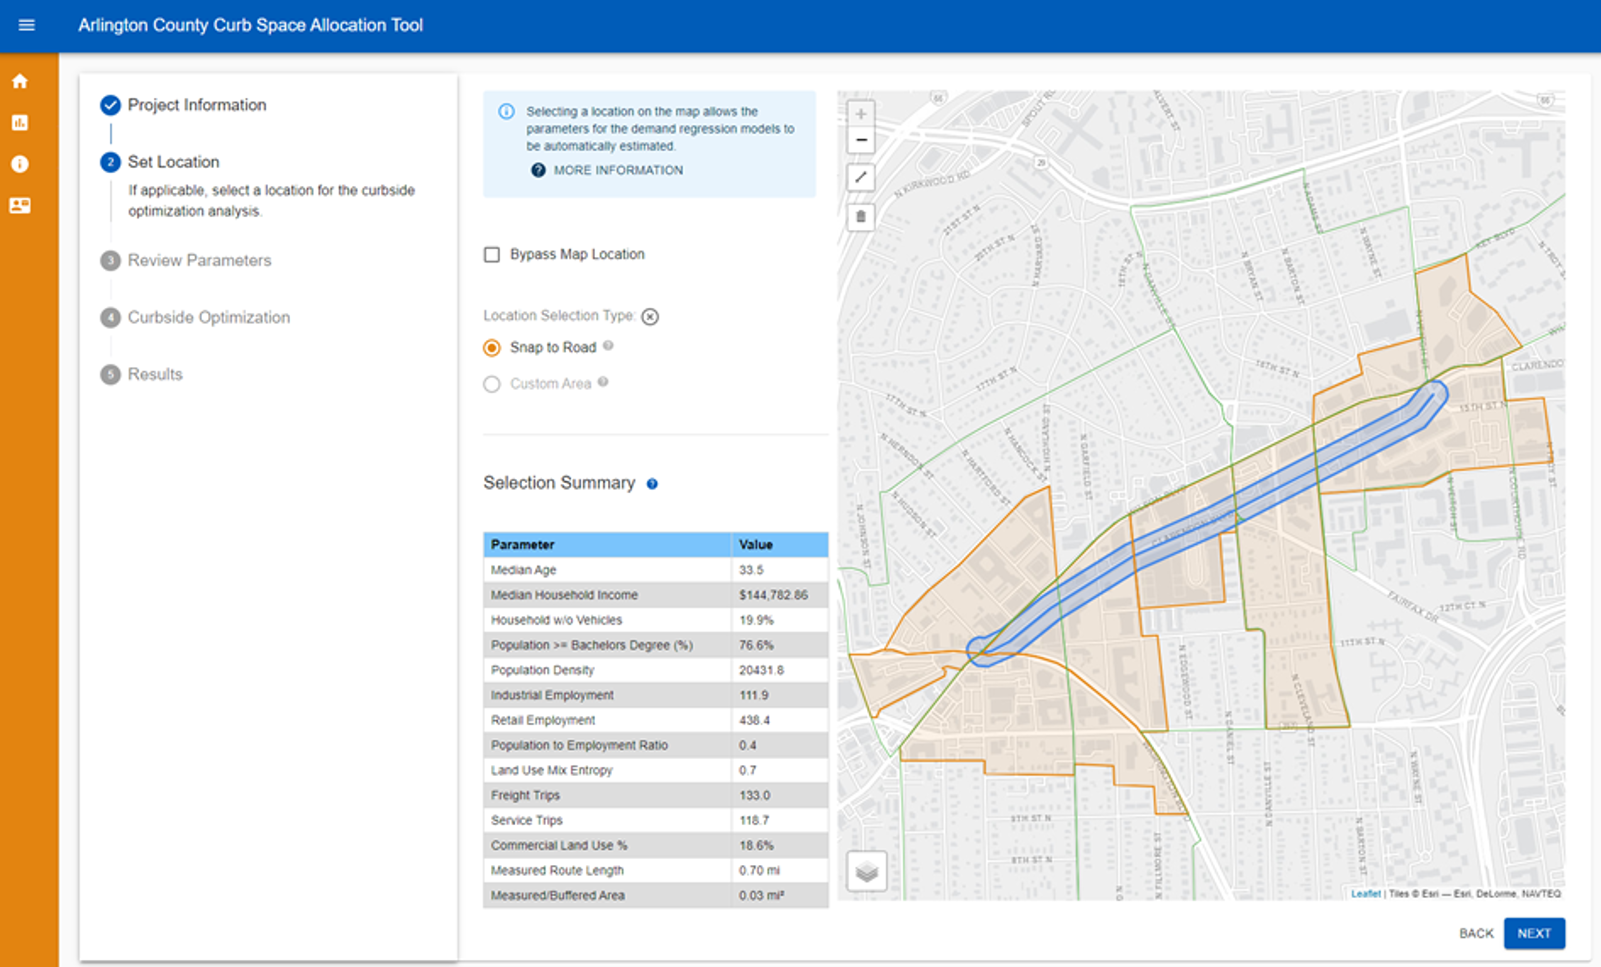
Kittelson’s work with Arlington County’s Curb Space Allocation Tool is one example of adapting existing infrastructure to meet changing travel demands. The data-driven tool helps optimize how limited curb space can best accommodate a growing range of users, including freight and package delivery vehicles, rideshare pick-up and drop-off activity, transit operations, micromobility services, short-term parking, and traditional vehicle parking. Historically, the primary question was how to allocate space among private vehicles seeking parking. Today, the same curb space must also support e-commerce deliveries, transportation network companies, accessibility needs, bus operations, and other time-sensitive activities that often require short but frequent access to the curb.
3) Learn how to plan under uncertainty. The long-term impacts of telework, e-commerce, automation, demographic change, and emerging mobility services remain difficult to predict. Agencies may benefit from more flexible, scenario-based planning approaches, rather than relying on a single forecast of future demand. For example, planners might evaluate how transportation investments perform under different telework adoption rates or population growth scenarios.
Ultimately, people taking fewer trips does not mean that transportation planning matters less. Instead, it means that the profession must redefine what success looks like in a lower-trip world.
Moving Forward in the New Reality
The new normal is here—but that normal might mean ongoing changes. Agencies who recognize and respond to travel behavior will be better equipped to make informed investment decisions and build transportation systems that serve communities effectively in the decades ahead.
Want to talk through what this new reality looks like for your community or agency? Reach out!