May 2, 2022
Data is powerful-but that power is only valuable to us when we can do something with it. In today’s world of ever-increasing data availability, the challenge at hand is taking advantage of what can be an overwhelming amount of information at our disposal, and distilling it into something we can act on.
By combining data sources and joining, comparing, and contrasting different data types, exciting insights can emerge. These insights can lead to a better understanding of underlying cause and effect dynamics. This is how agencies can strategically tap into data sources to monitor impacts, identify shortfalls, and adjust programs or action plans, ultimately using technology as a tool to meet their overall goals.
Here are examples from six transportation agencies who have partnered with us to tap into data and build tools and dashboards that make decision-making on projects quicker, easier, and more informed.
FREEVAL-PA
Agency: Pennsylvania Department of Transportation (PennDOT)
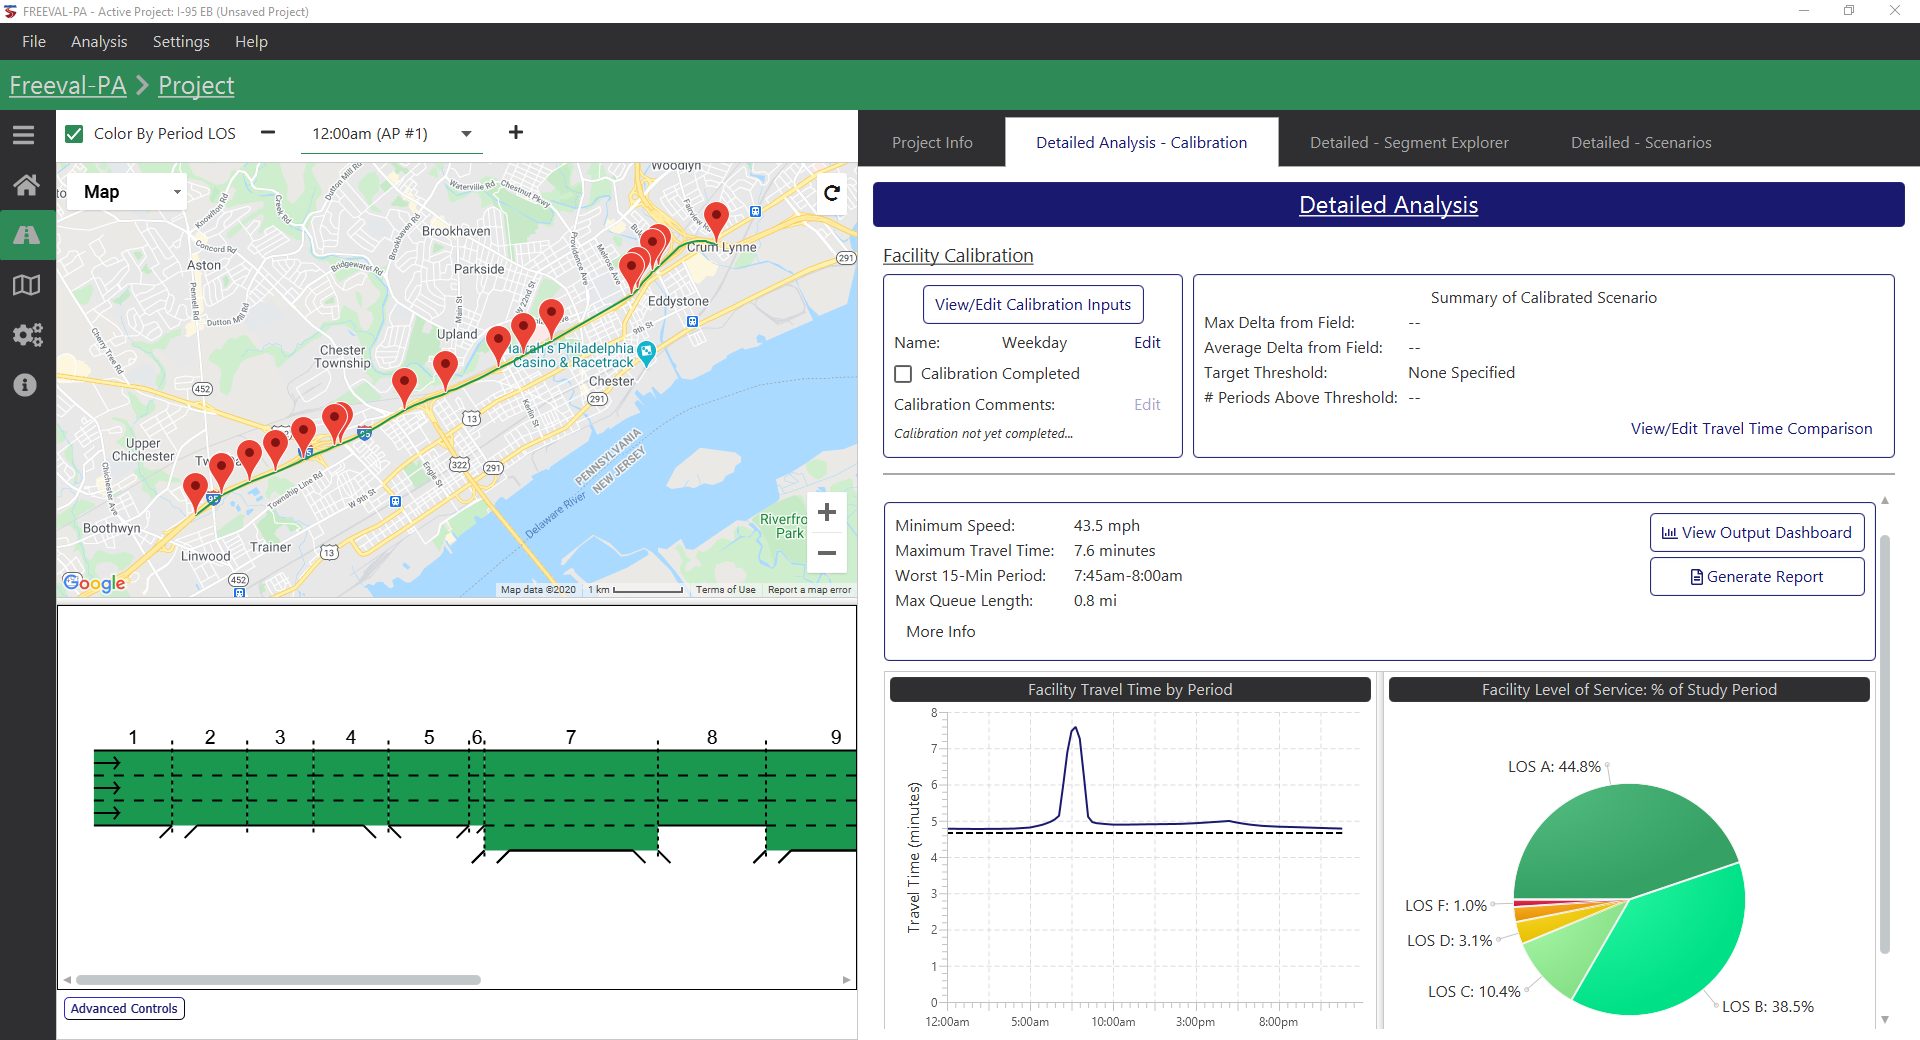
Historically, identifying the optimal timing and strategy for construction and maintenance projects on freeways is complex. To pinpoint times and locations for work zones that don’t result in costly congestion and frustrated drivers, transportation engineers have turned to simplifying spreadsheets that miss necessary detail, or cumbersome microsimulation models that can take weeks to populate and customize. And while our experience shows that agency veterans can often make very sound lane closure decisions based on decades of experience, we also see that institutional knowledge disappearing.
Kittelson’s software development team worked with PennDOT to develop FREEVAL-PA, a software tool that takes the time and complexity out of these analyses on limited-access highways, enabling practitioners to quickly obtain information about what traffic impacts they’ll see from different types of construction and maintenance projects.
It can do this because we pre-loaded it with information about all of Pennsylvania’s interstates and freeways. The software tool is programmed with the roadway characteristics of freeway segments, along with traffic volume and speed data, weather data, terrain data, and a computational engine powered by the Highway Capacity Manual’s freeway facility method. With a few simple inputs, the tool can provide an immediate idea of what impacts can be expected from various lane closures and work zone scenarios depending on the location, season, time of day, and other factors. It takes just a few hours to perform a more detailed analysis that provides the full set of Highway Capacity Manual performance measures, including delays, travel times, queuing, and user cost outputs. These detailed results allow for a comprehensive analysis of freeway operations for construction, maintenance and planning/design projects. And for even quicker turn-around, the planning-level utility allows the user to arrive at a high-level estimate in minutes.
For more information about FREEVAL, contact Bastian Schroeder and Lake Trask.
FDOT D6 Bike/Ped Planning Tool
Agency: Florida Department of Transportation (FDOT) District Six
The 1,675 pedestrian deaths between 2010 and 2019 place Miami-Dade County 13th among the country’s most dangerous metro areas for walking, according to Smart Growth America’s Dangerous by Design 2021. Fortunately, our clients at FDOT are going all in on pedestrian and bicyclist safety through better road design, education, and enforcement. But the scale of the challenge is immense: Miami-Dade County has more than 1,500 miles of non-residential roadways, which is equivalent to the distance between Miami and Bogotá, Colombia. Where should FDOT focus efforts to improve pedestrian and bicyclist safety?
To answer this question, FDOT worked with a Kittelson project team in Florida to develop a prioritization tool that would factor in the many pieces of this puzzle-such as safety, connectivity, demand, and equity-to lead to projects being built. The web-based tool we developed is helping the FDOT bicycle and pedestrian coordinator bring up pedestrian and bicycle needs to the forefront of upcoming projects. It is also a valuable tool for her coworkers to get a better understanding of the pedestrian and bicycle experience on the corridor projects they are working on. And in another innovative twist, FDOT is using the tool to assess crowd-sourced feedback received from the mobile app Ride Report. We are currently working with FDOT to further integrate the tool into its workflow and to consider expanding it to help other Florida counties and cities as well.
For more information about the FDOT D6 Bike/Ped Planning Tool, contact Jorge Barrios and Jessica Josselyn.
Arlington County Curb Space Allocation Tool
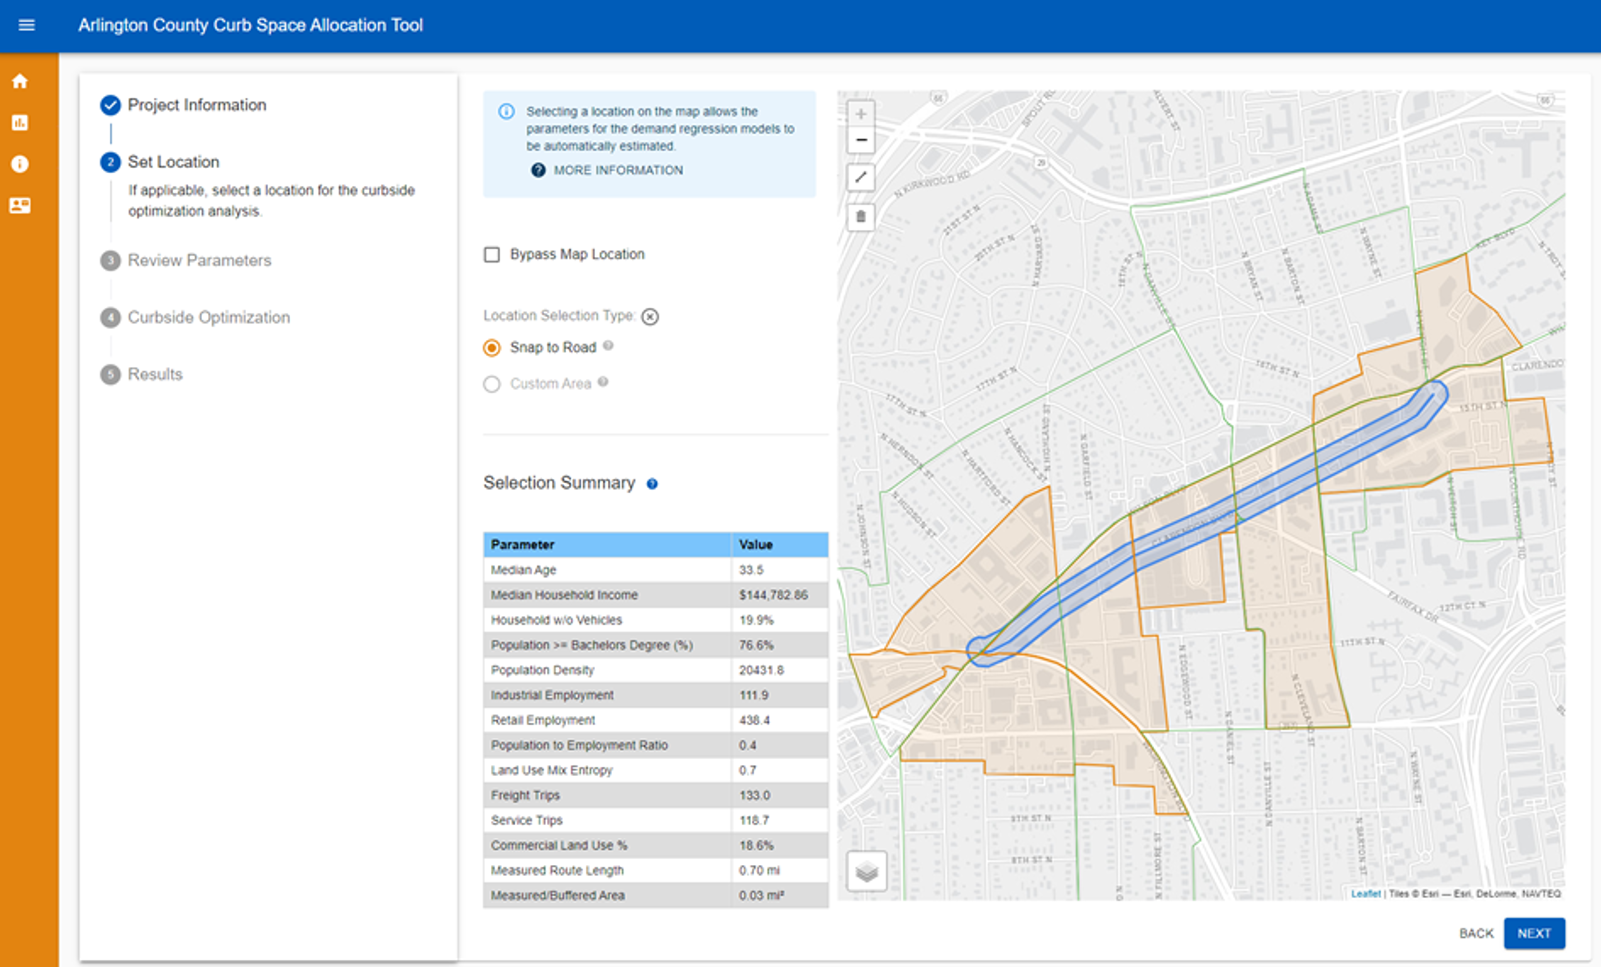
In recent years, the rise of ride-hail apps, e-commerce deliveries, and the revolution in micro-mobility services has fundamentally changed the transportation landscape at the curbside. Practitioner groups, such as ITE, have developed general principles and hierarchies for allocating curb space-but how do planners/engineers put those principles into practice on a particular curb? Arlington County, Virginia, staff sought a tool to help them determine the optimal allocation of curb space given a block’s existing or proposed land uses, transportation services, using demand calculated from the surrounding context.
Kittelson’s software development team developed a curb space allocation tool that uses six modules-ride-hailing services, commercial loading, on-street parking, transit service, micromobility, and non-transportation uses-to estimate the demand for various curb uses and the relative value of various curb allocations at the block level. The user inputs the available curb length net of space reserved for safety requirements into a web interface that features a map-based study-area selection tool. Using demographic data, land use data, and equations derived from existing literature, the tool allocates the available curb space to maximize the economic or societal benefit based on the available curb length. View it here.
For more information about the Arlington County Curb Space Allocation Tool, contact Alek Pochowski, Lake Trask, Like Liu, or Jamie Henson.
Safety Screening Web Map Application
Agency: Stanislaus County
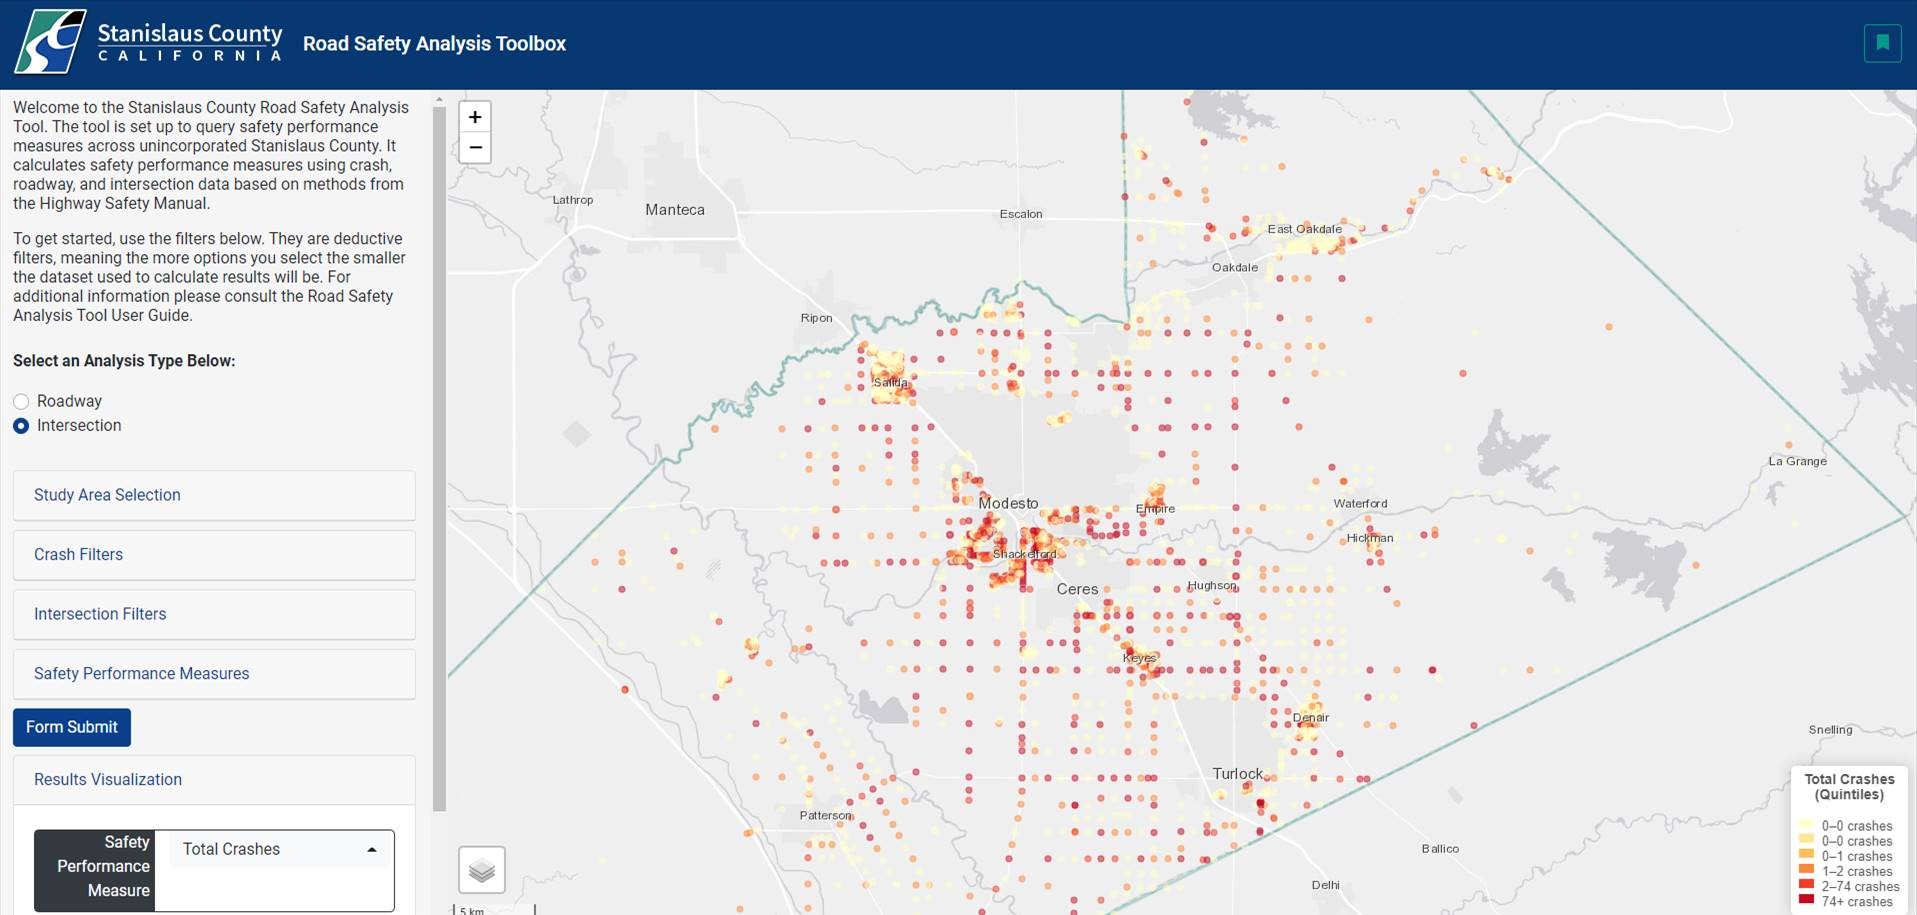
With the increasing focus on roadway safety, the advent of local road safety plans, and still-expanding vision zero policies, agencies are in need of ways to identify and prioritize locations for safety improvements. Network screening is a critical step for an agency to evaluate its transportation network: it allows an agency to identify and rank sites based on a selected performance measure. Traditional performance measures, such as crash frequency, severity-weighted frequency, and crash rate, enable an agency to rank sites based on the highest total impact and target high-priority safety improvements.
By automating much of the network screening process and packaging the analysis into a webtool, an agency can quickly and flexibly screen the network to answer a greater number of questions. Kittelson worked with Stanislaus County to develop a web-based screening tool that implements all 17 network screening performance measures listed in the Highway Safety Manual. As a result, the County can quickly ask and answer far more questions about the safety performance of its network. Targeted network screening helped the County identify and obtain $8.5 million through HSIP Cycle 10 to implemented systemic safety countermeasures on 84 miles of roadway and at 12 unsignalized intersections.
For more information about Stanislaus County’s safety screening web map application, contact Alex Garbier, Lake Trask, and Matt Braughton.
FDOT Source Book
Agency: Florida Department of Transportation (FDOT)
The Source Book is FDOT’s collection of transportation system safety, mobility performance, and innovation trends. It has evolved over time to include a variety of multimodal trends and measures, including mobility conditions on Florida’s roadway network; performance for Florida’s airports, transit services, railways, spaceports, and seaports; and system preservation, economic indicators, and emerging transportation technologies. Kittelson staff in Florida work closely with FDOT to develop and evaluate performance measures, incorporate them into the Sourcebook, and use that information to identify congested corridors. Explore the Source Book here.
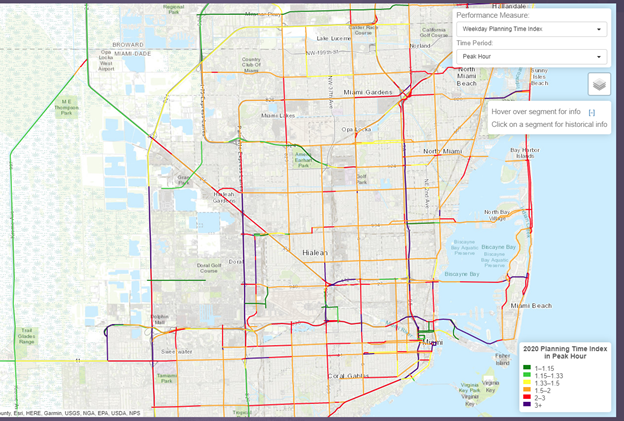
In 2020, due to the drastic impact on travel patterns caused by the COVID-19 pandemic, we needed a new method of retrieving this data to make it practical to obtain it every month, so we created FDOT’s Current Conditions Mobility Reports to track travel trends over the course of the pandemic. These reports included a set of multimodal metrics covering automobile travel, freight movement, crashes, air travel, as well as metrics providing context on other aspects of life impacted by the COVID-19 pandemic, such as small businesses open and unemployment rates. These metrics offered a telling narrative in conjunction with transportation metrics that may have suggested changes in travel patterns.
For more information about the FDOT Source Book, contact Jorge Barrios, Yihang Sui, or Tyrone Scorsone.
FAMPO Congestion Management Dashboard
Agency: Fayetteville, NC Area Metropolitan Planning Organization (FAMPO)
In response to FHWA’s directive to major MPOs to monitor and set reliability targets within the Congestion Management Process (CMP), our software development team is in the process of developing dashboards for several agencies to help visualize travel time reliability and congestion using vehicle probe data from NPMRDS. Below is an example prototype we developed for FAMPO, which is undertaking a comprehensive update to its CMP. The dashboard will allow the user to set and track corridor performance goals, view detailed time of day trends, and monitor results from year to year as new data are gathered.
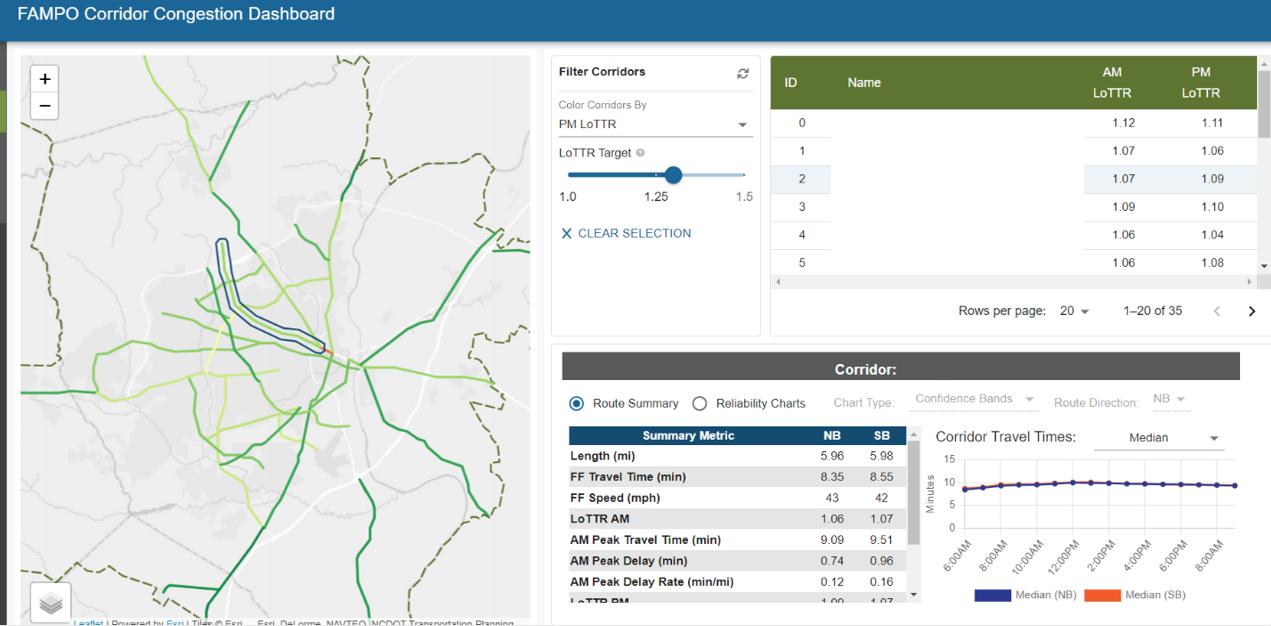
For more information about the FAMPO Congestion Management Dashboard, contact Zachary Bugg, Lake Trask, and Bastian Schroeder.
Kittelson’s software development team enjoys the opportunities and challenges of creating custom IT solutions and tools that meet our client’s needs. If you’d like to learn more about any of the tools mentioned in this article, please reach out to Bastian Schroeder or Lake Trask.